1. Product Database
1.1 Product Research
1.1.1 Usage Scenario
For those Amazon sellers who want to find high-demand low-competition products, AmzChart helps them work on the research regarding metrics such as Amazon sales rank, Amazon BSR fluctuates of one product under primary or subcategories in a different period, as well as changes in price and reviews.
1.1.2 Data Sources
The product data presented on the website are powered by our powerful database, it updates daily, and the updates will be displayed on AmzChart in real-time.
1.1.3 Introduction to Functions
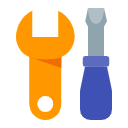
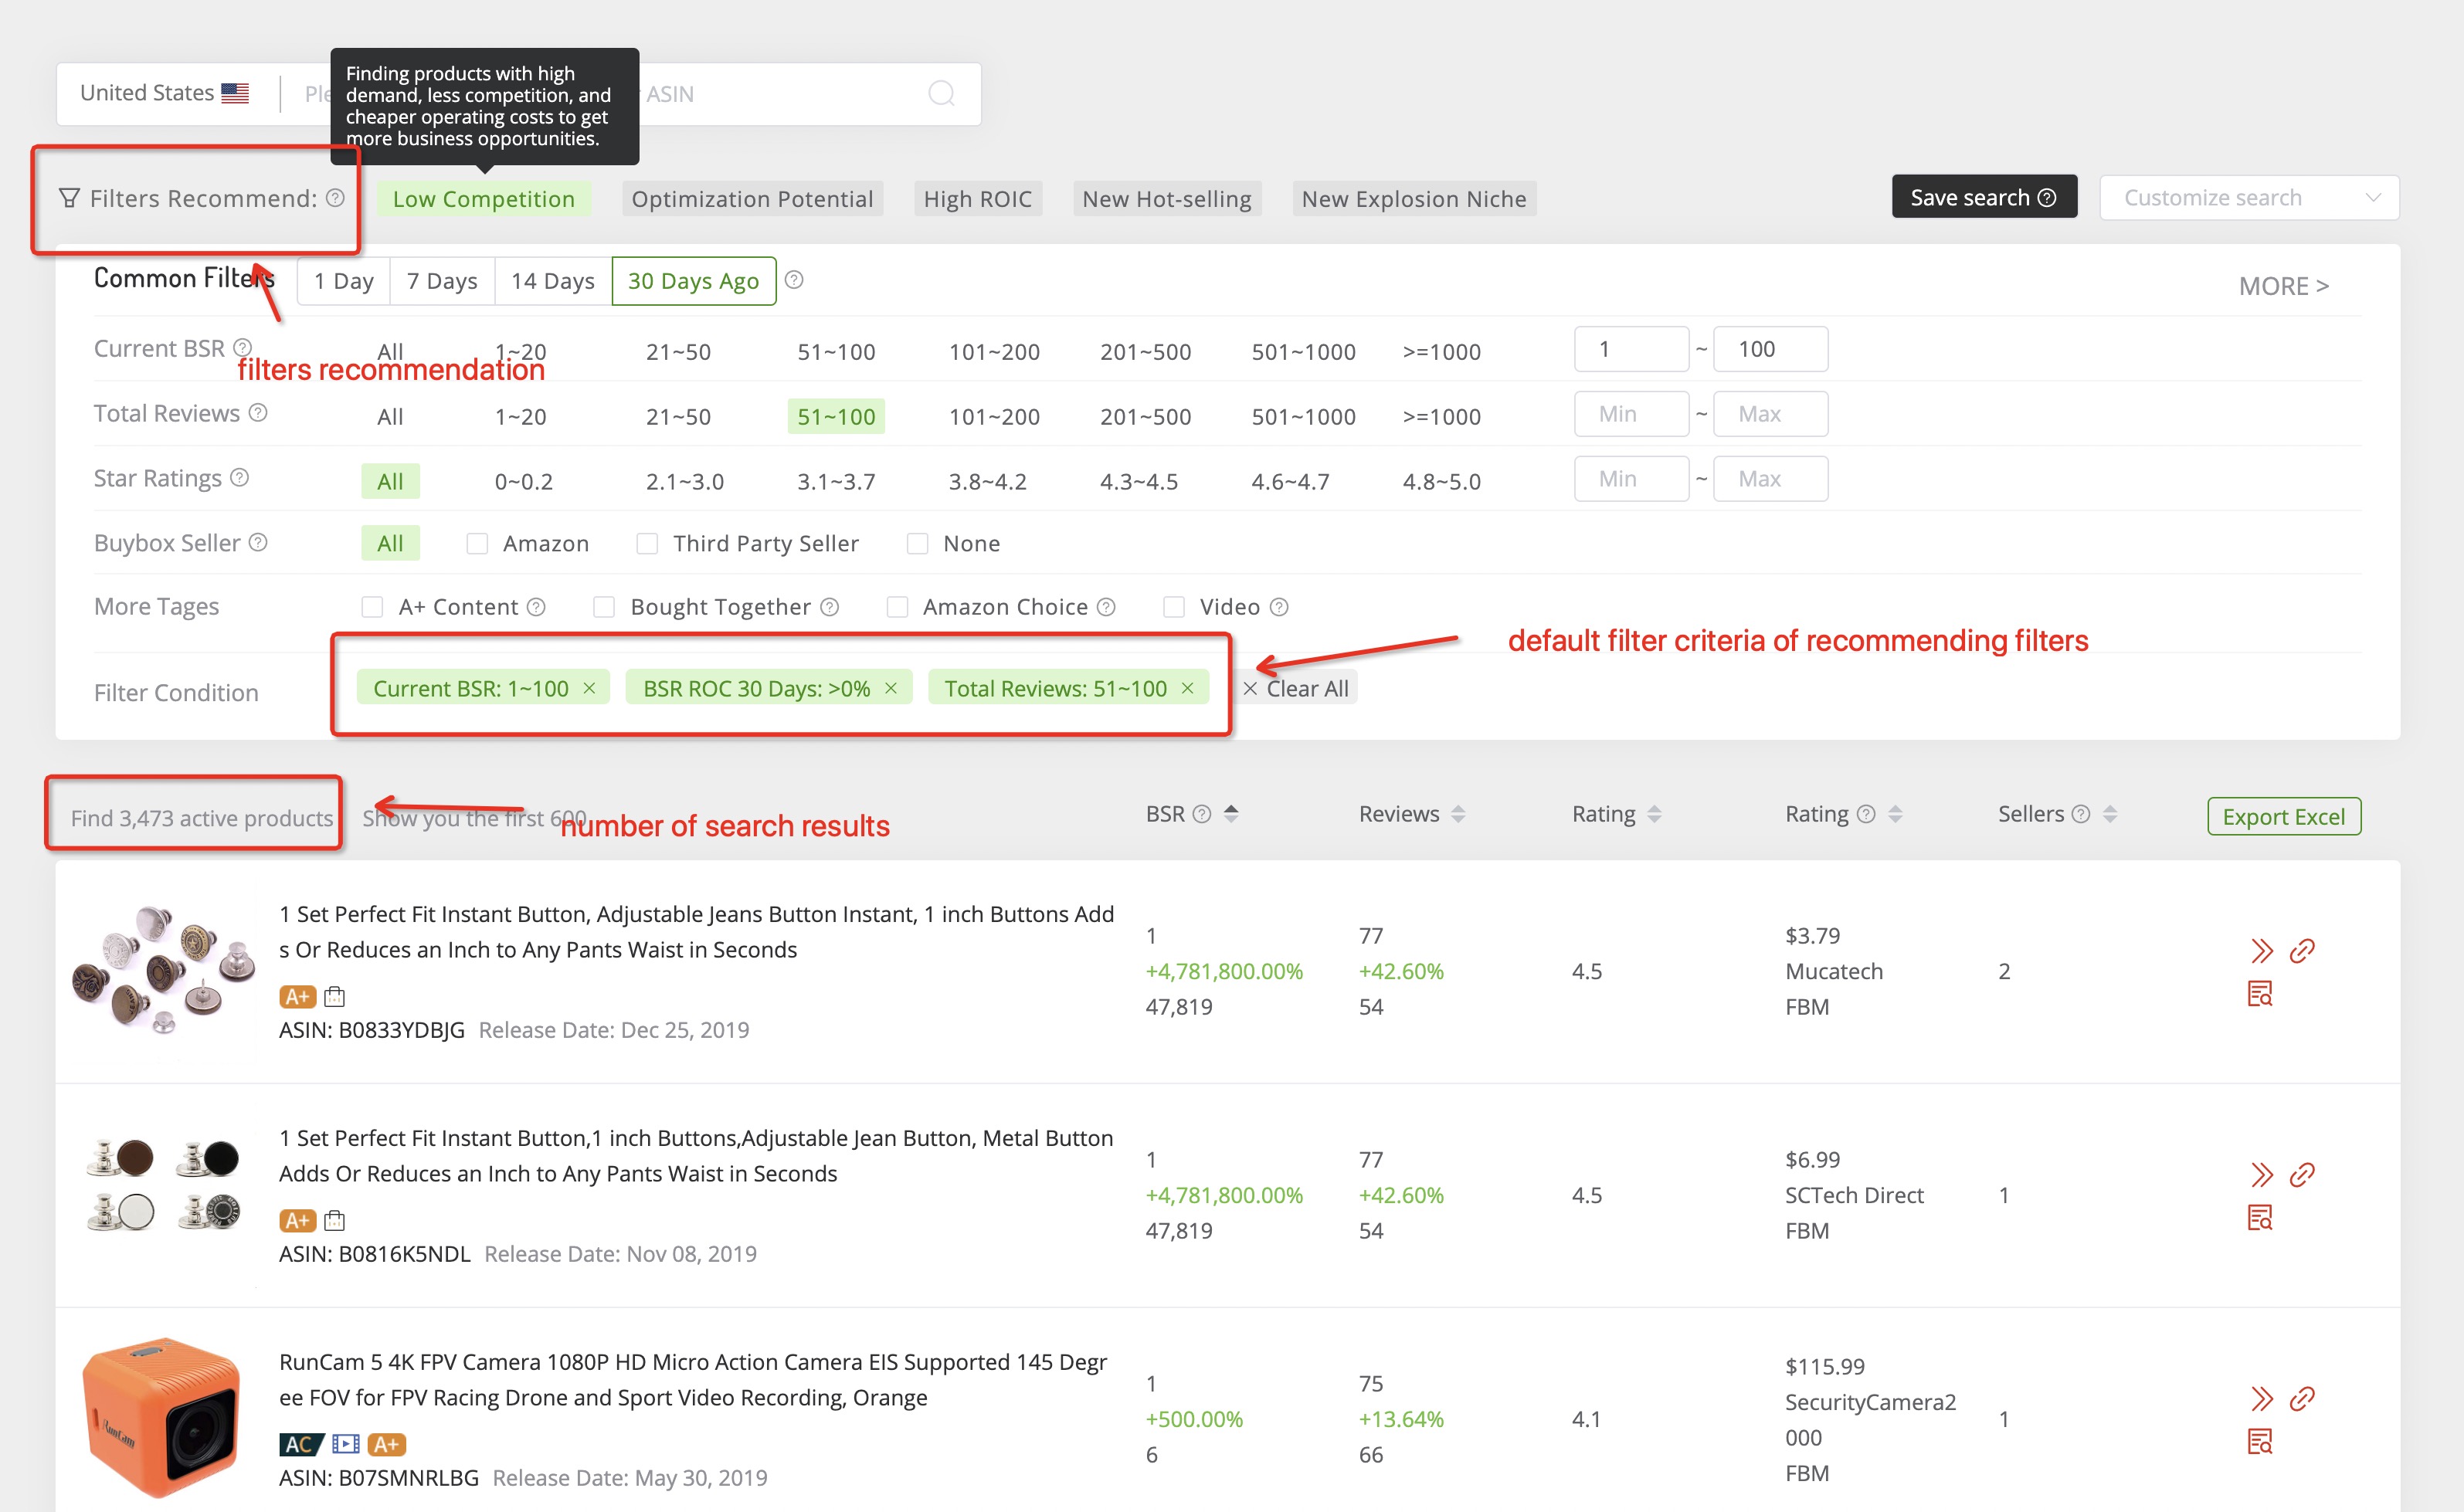
1.1.3.1 Select the Amazon marketplace first (now only the US marketplace available), input keywords or ASIN in the search bar, then set filter criteria based on your preferences below the search bar, click “search” or press the Enter key to start searching. Then you will get a long list of product results that meet your requirements.
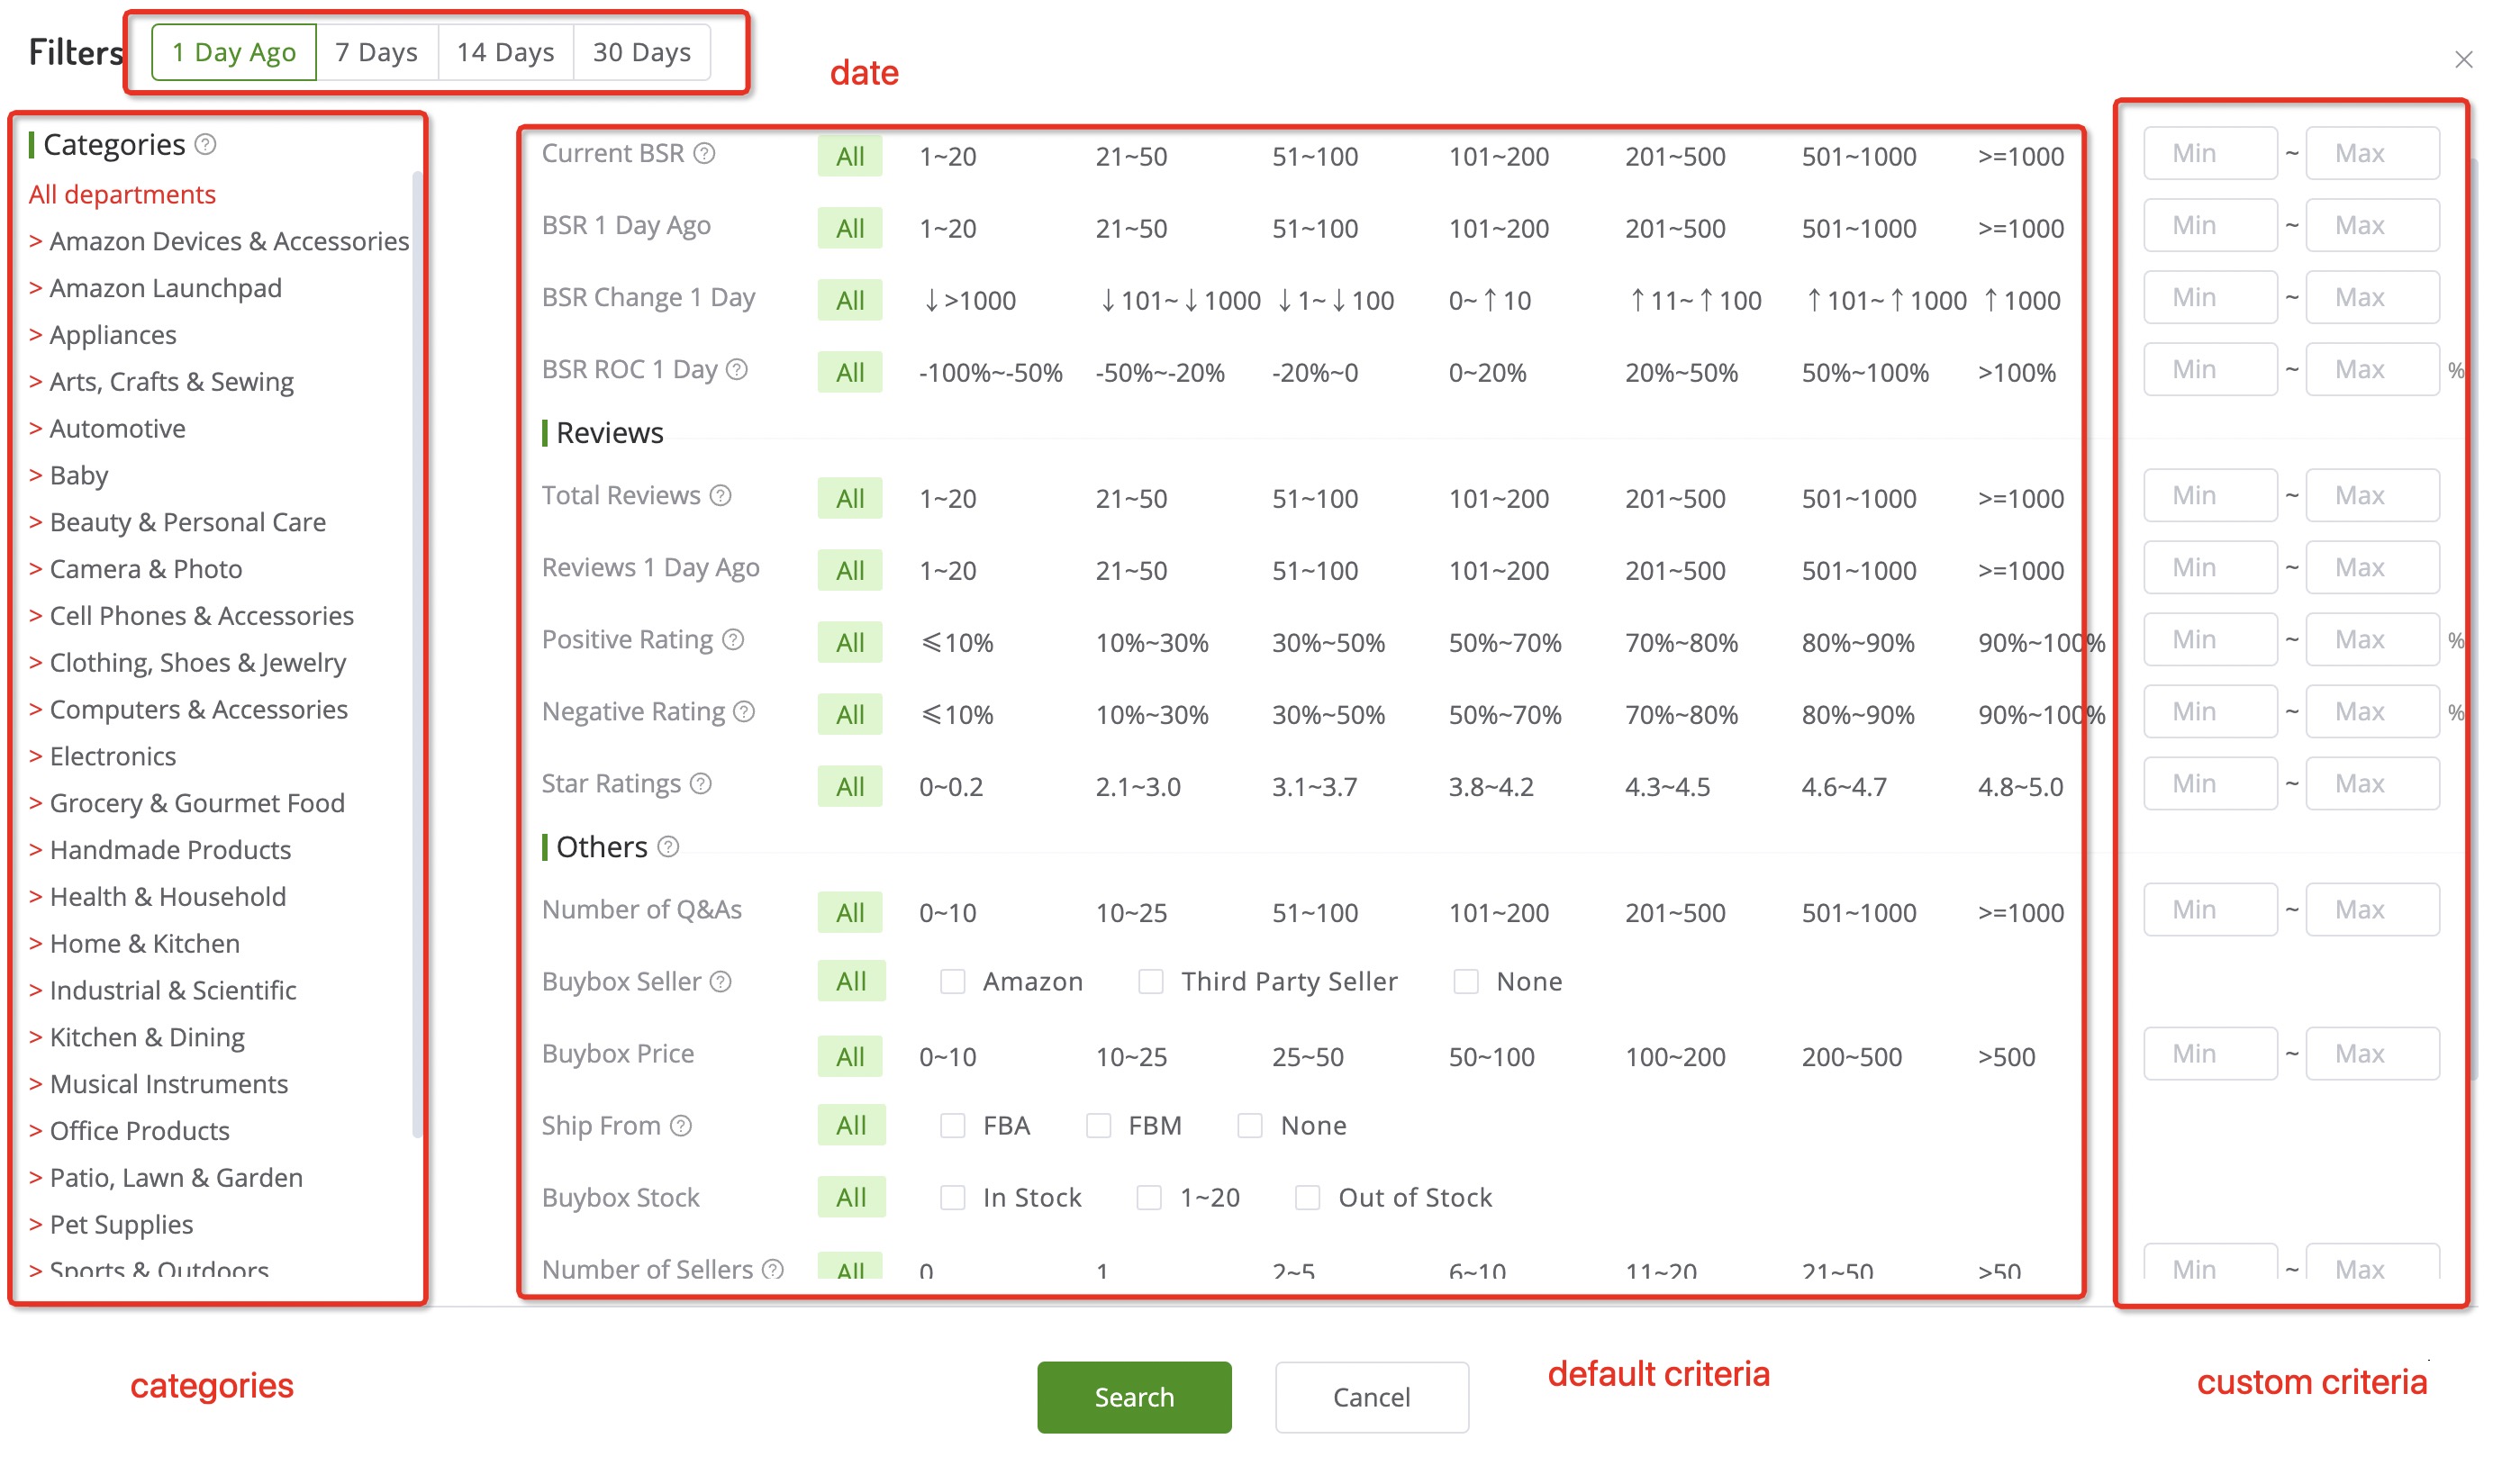
1.1.3.2 Click “MORE” in the upper right corner of the filter section to get comprehensive filter criteria, and you can add detailed filter criteria such as date, categories, BSR, etc., to filter out the more precise products that meet your needs.
1.1.3.3 For beginners, AmzChart also provides five recommendation filters. By clicking any of them, you can find some latest potential products and opportunities in just one second.
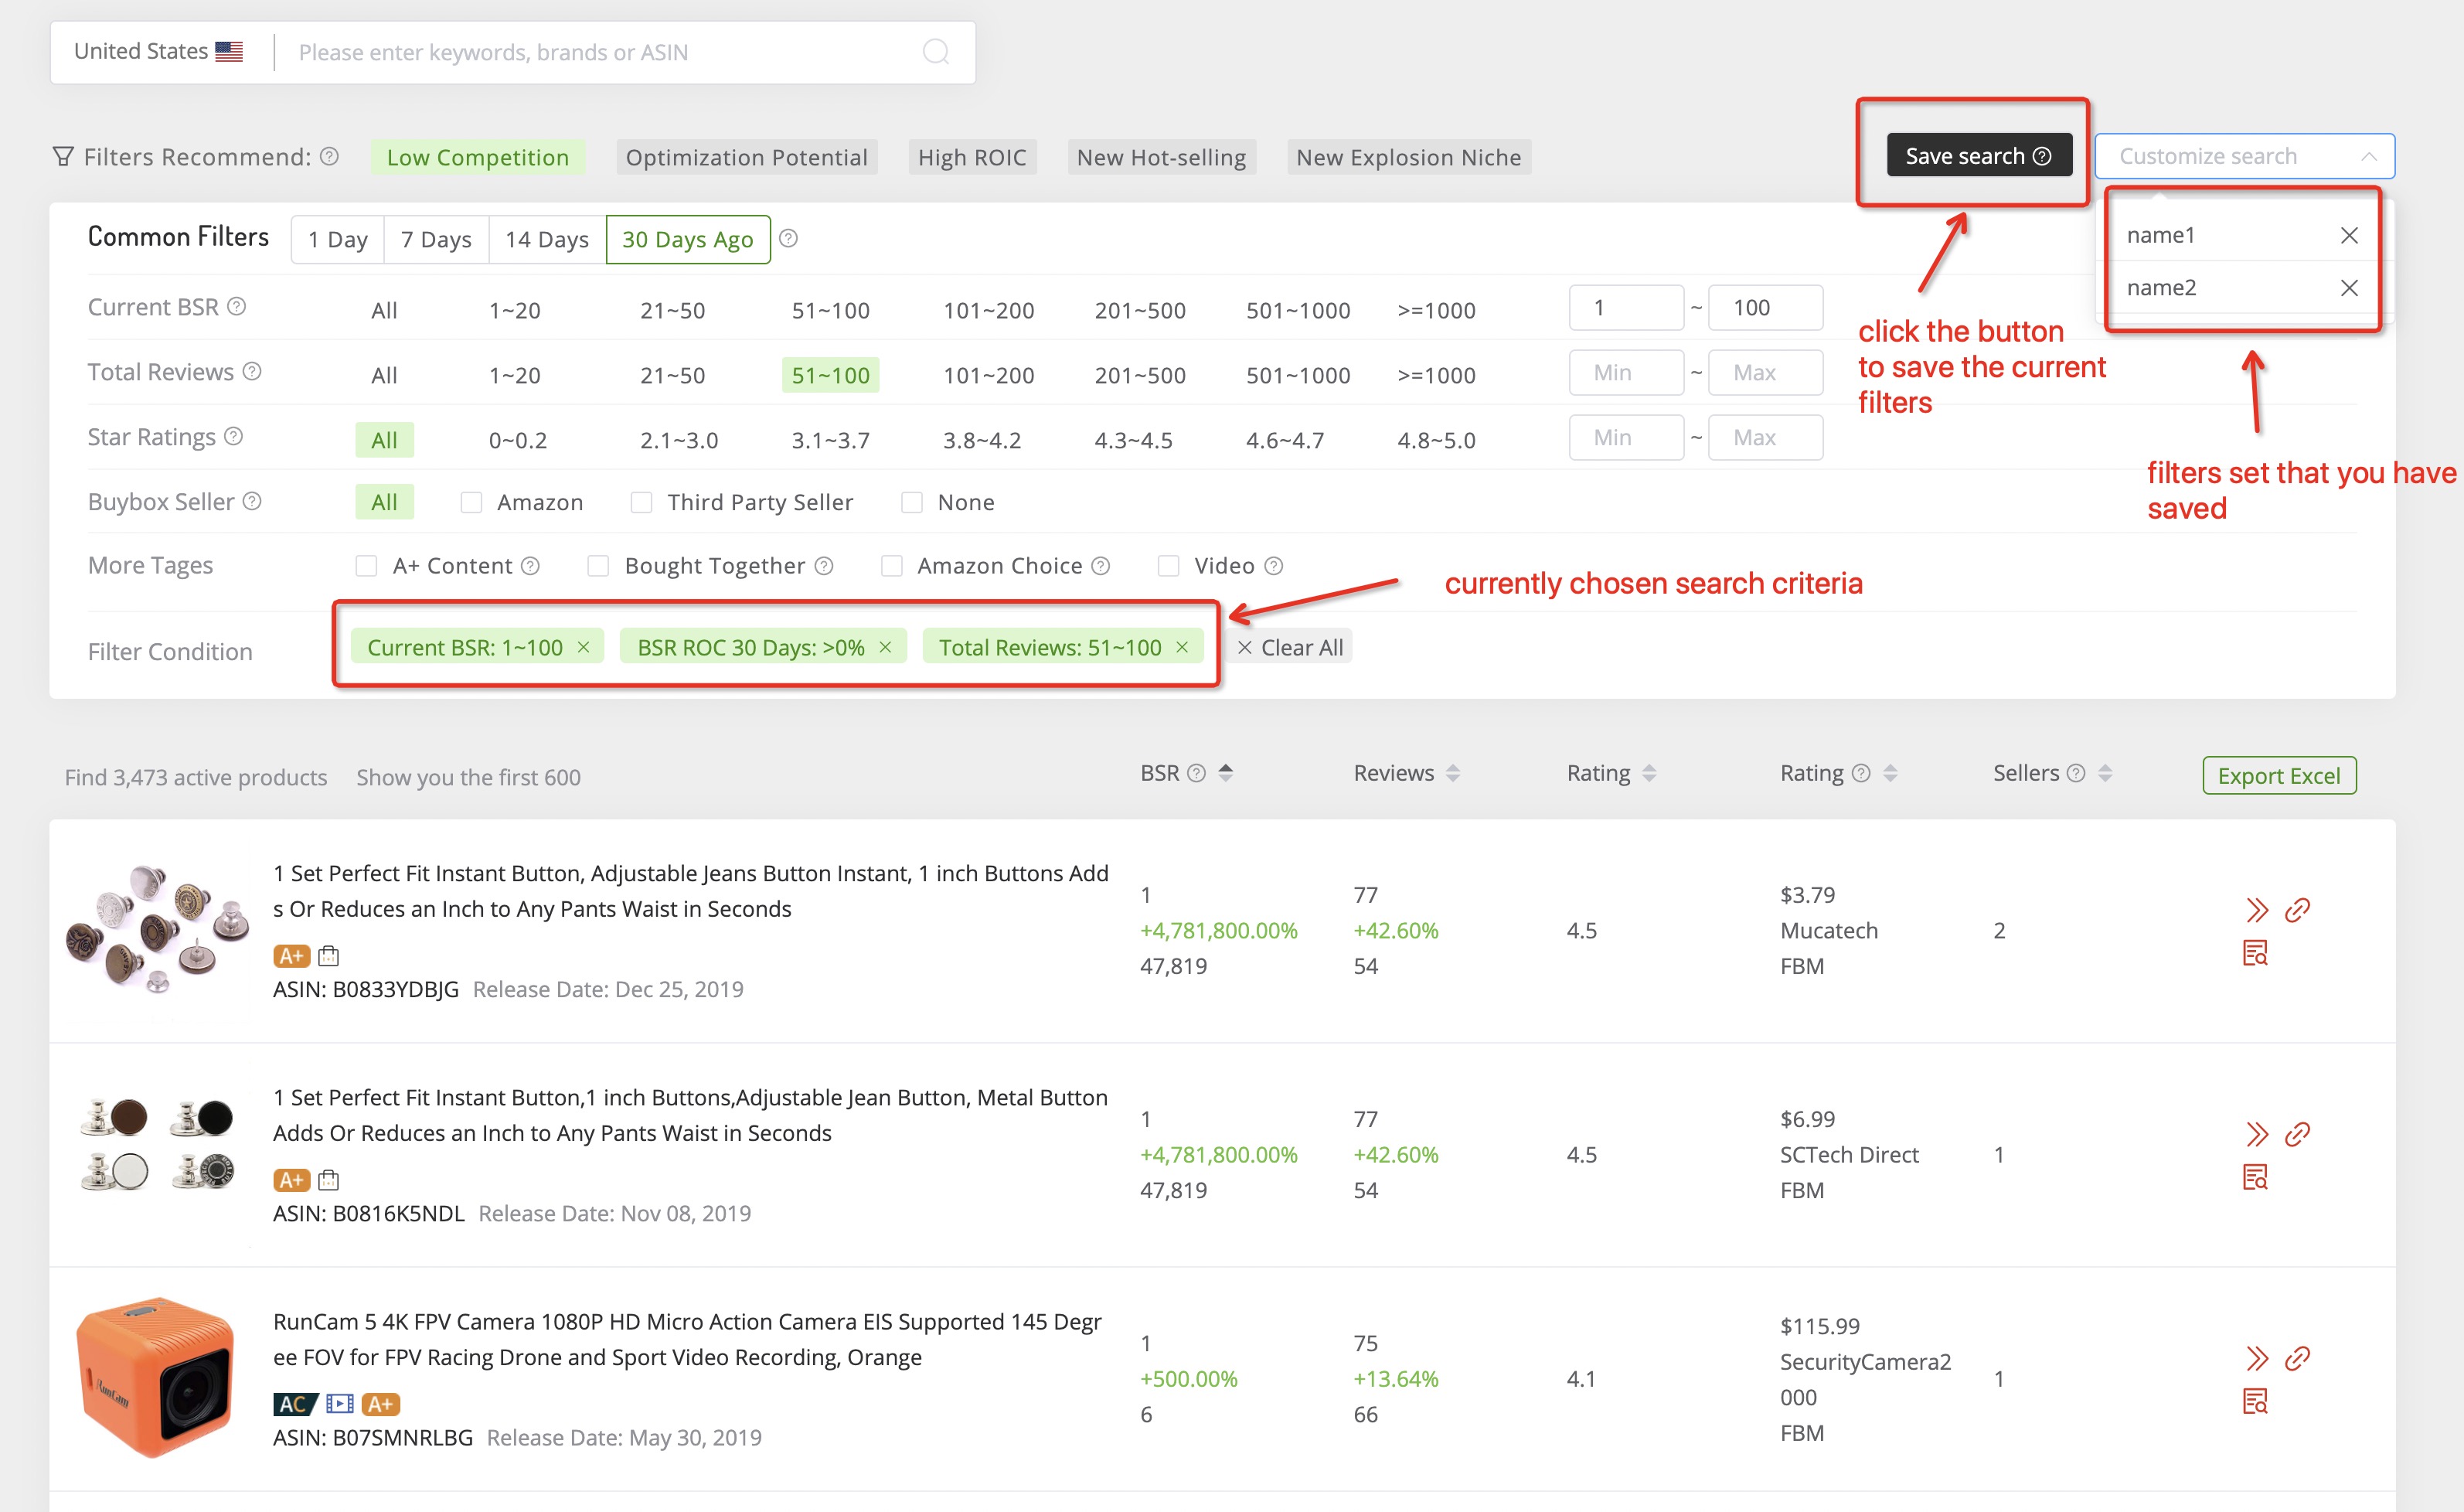
1.1.3.4 By clicking the “save search” button to save the currently chosen filter criteria and name it. Next time you can directly click the name you have saved in the drop-down list of the search bar next to “save search” rather than input the search criteria again.
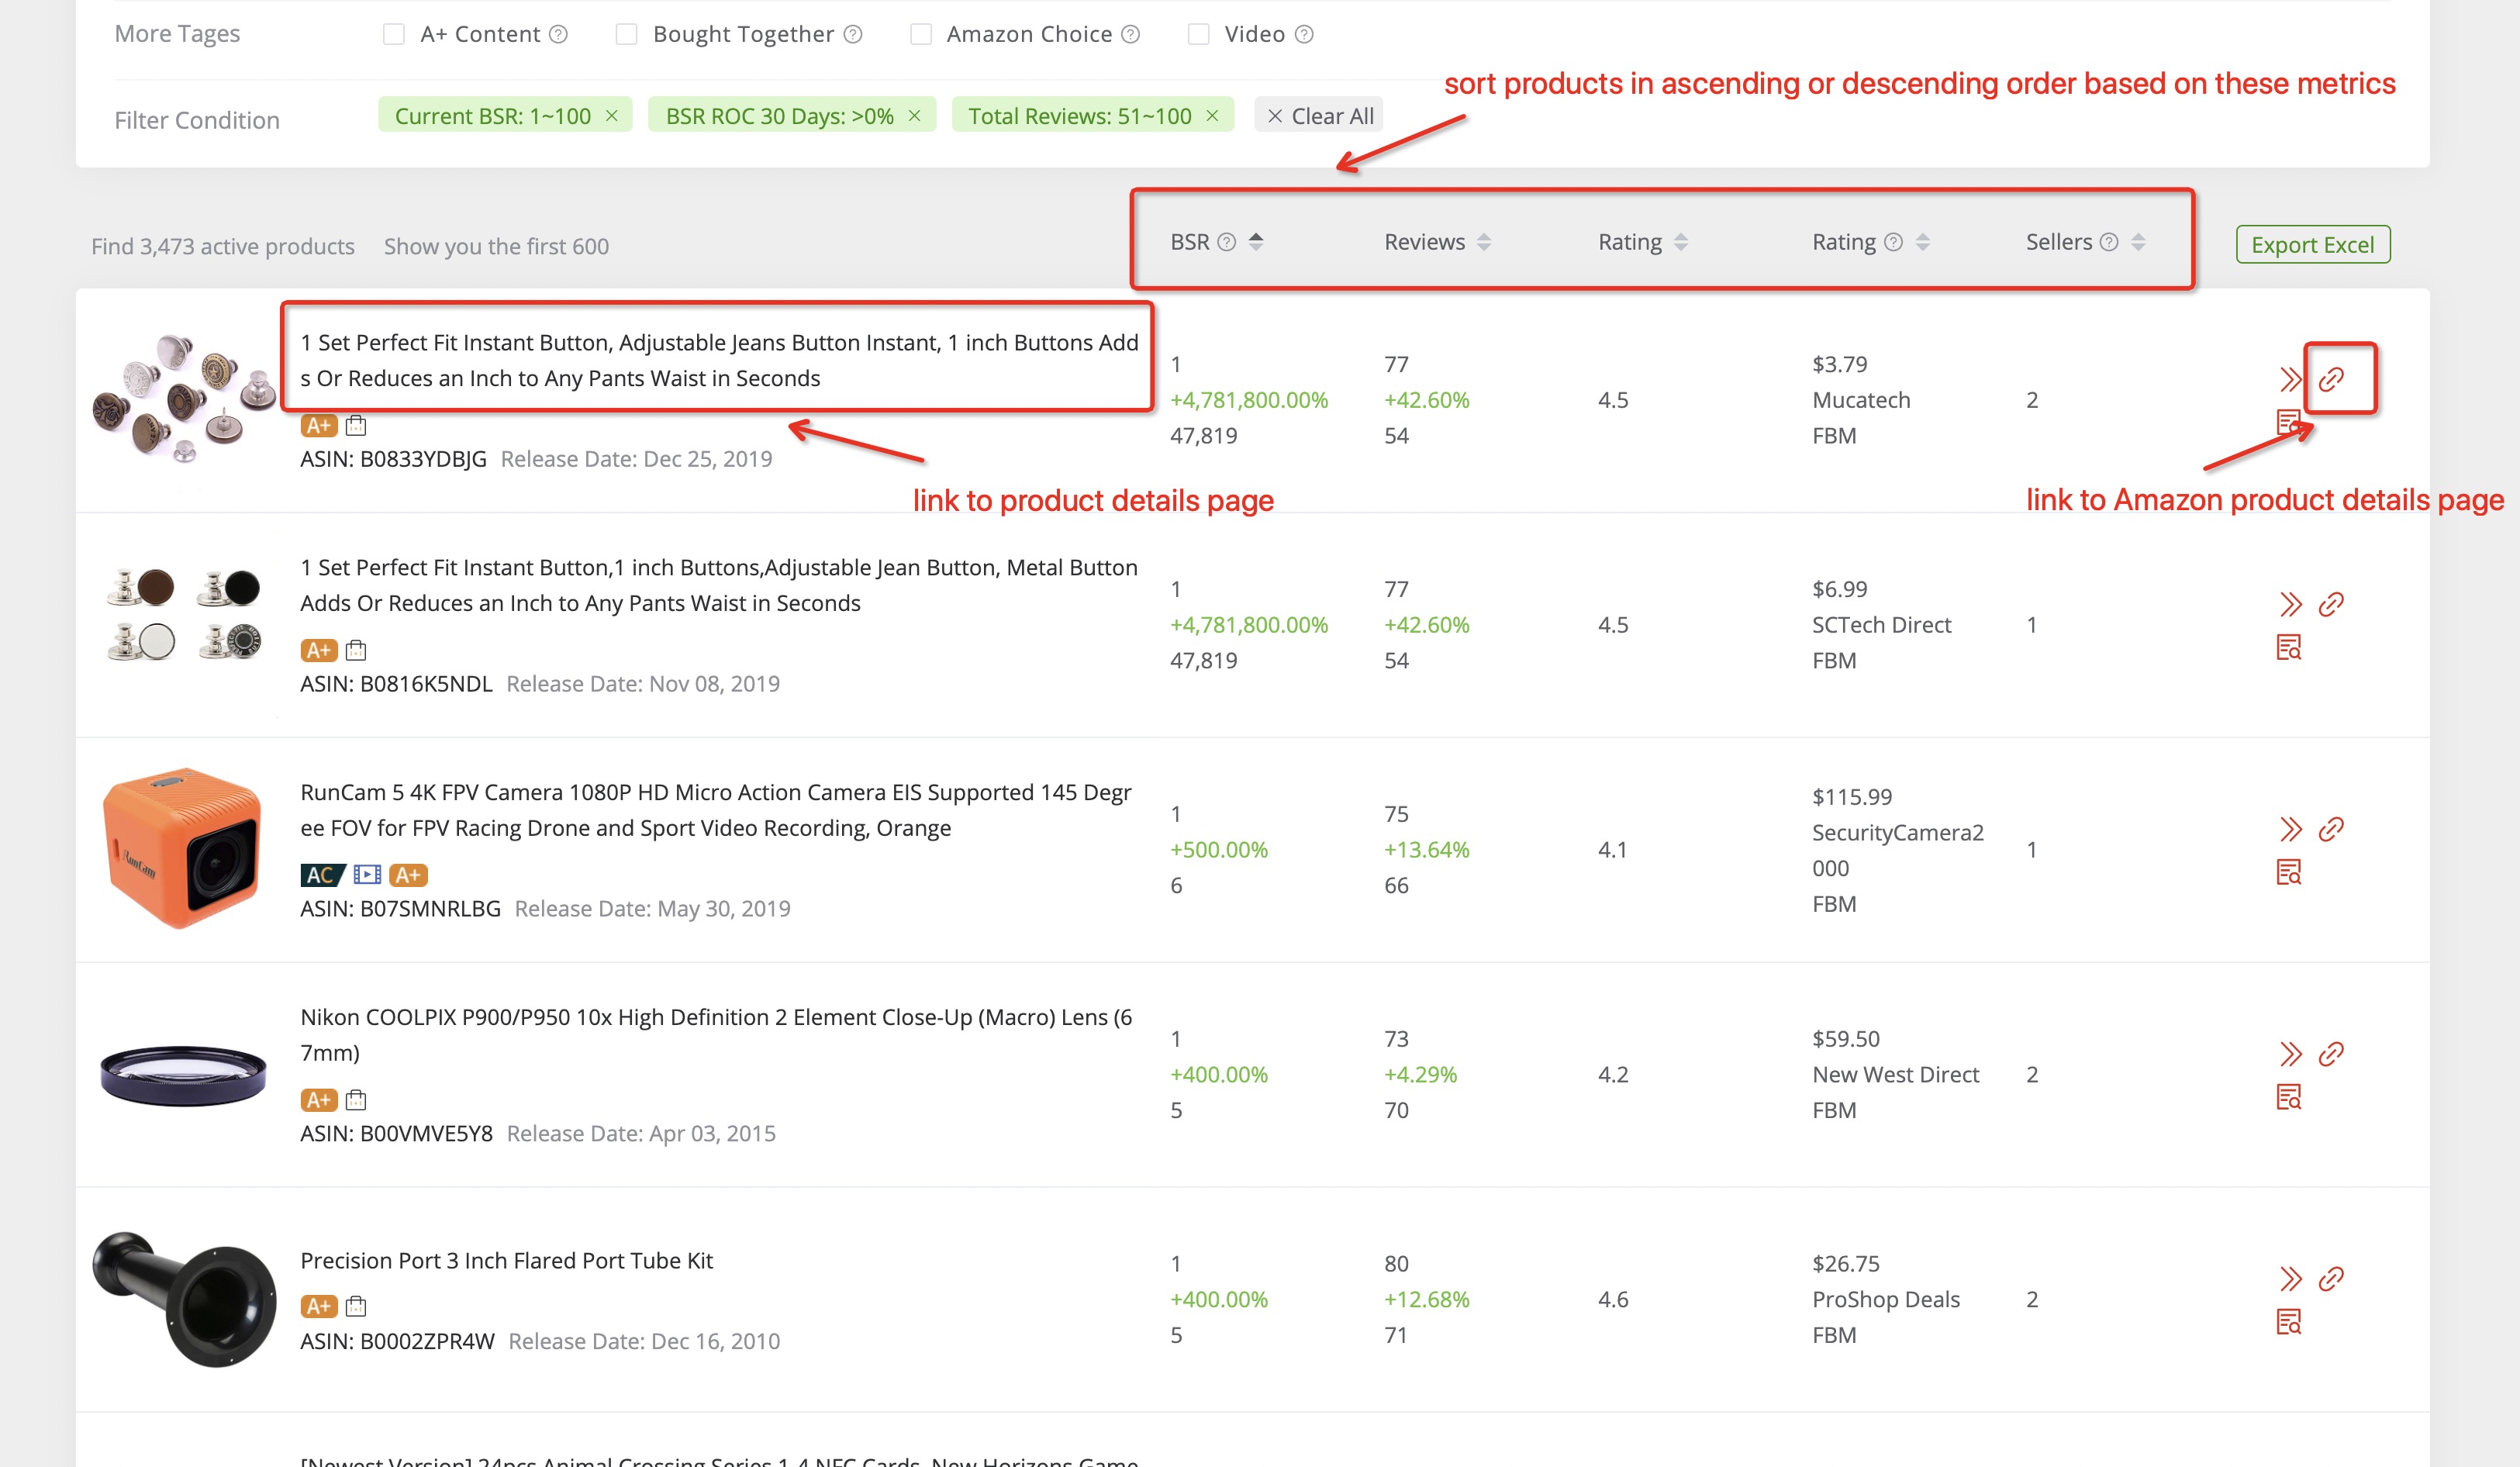
1.1.3.5 After searching, you will get a long list of product results, and they can be sorted in ascending or descending order based on BSR, reviews, rating, BuyBox price, and the number of sellers. When clicking the product title or the “product details” icon, it will link to the product’s details page. While clicking the “link” icon, it will link to the Amazon product details page regarding this product.
1.2 Product Details Analysis
1.2.1 Usage Scenario
After selecting one specific product in the product searching page, it will link to the product details page to get more details regarding this product, such as category path, BSR fluctuation, the trends of reviews, and trends in some basic metrics.
1.2.2 Data Sources
The product details data presented on AmzChart are powered by our powerful database and it updates daily.
1.2.3 Introduction to Functions
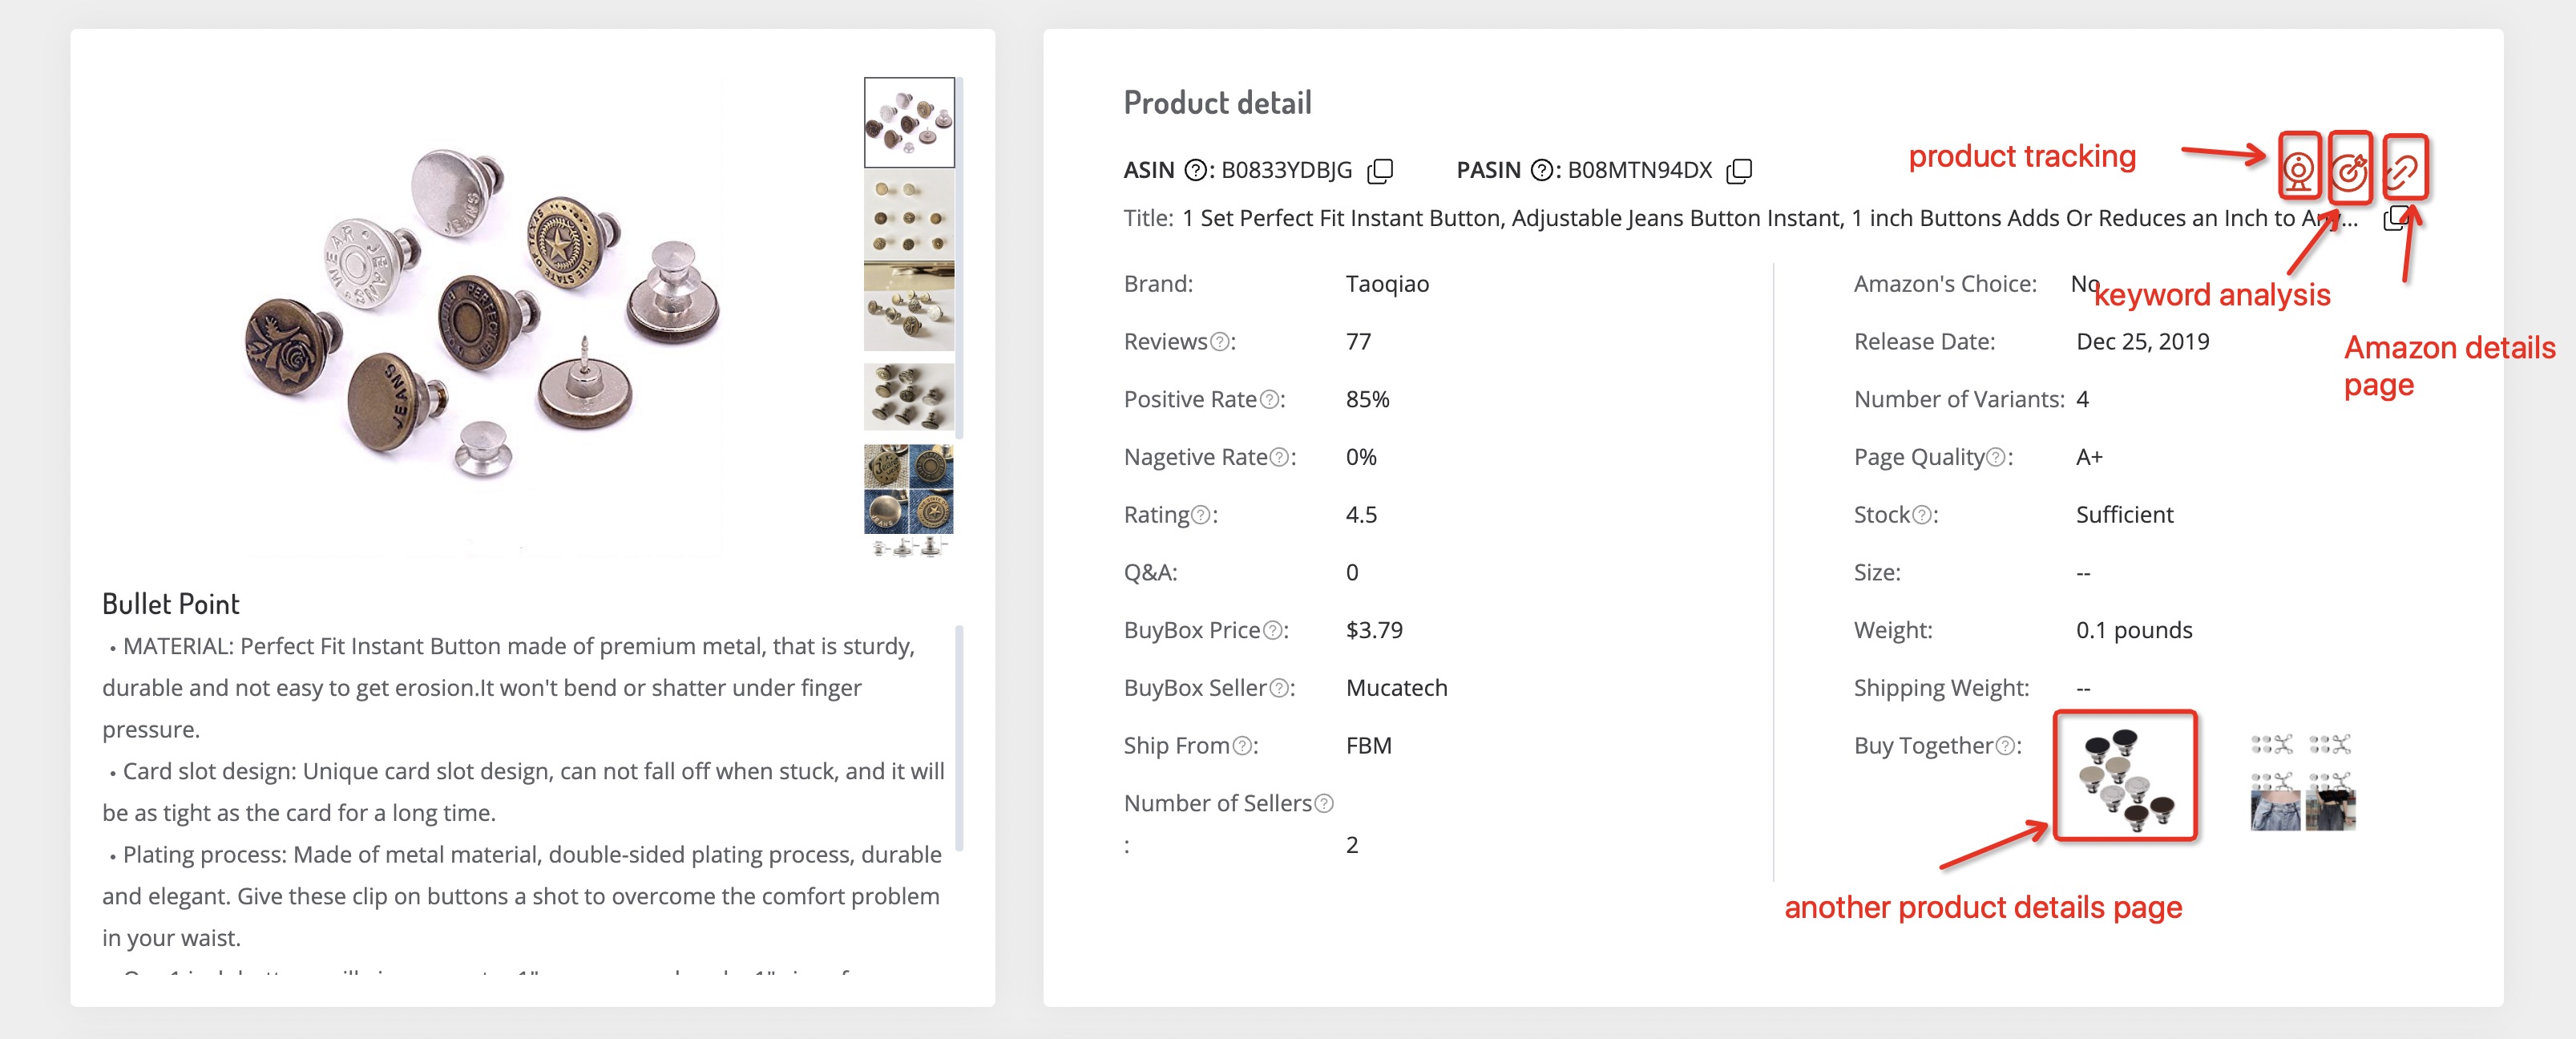
1.2.3.1 The product details including images, descriptions, and other info. Also, you can copy the ASIN, PASIN as well as product’s title separately by clicking the “copy” icon.
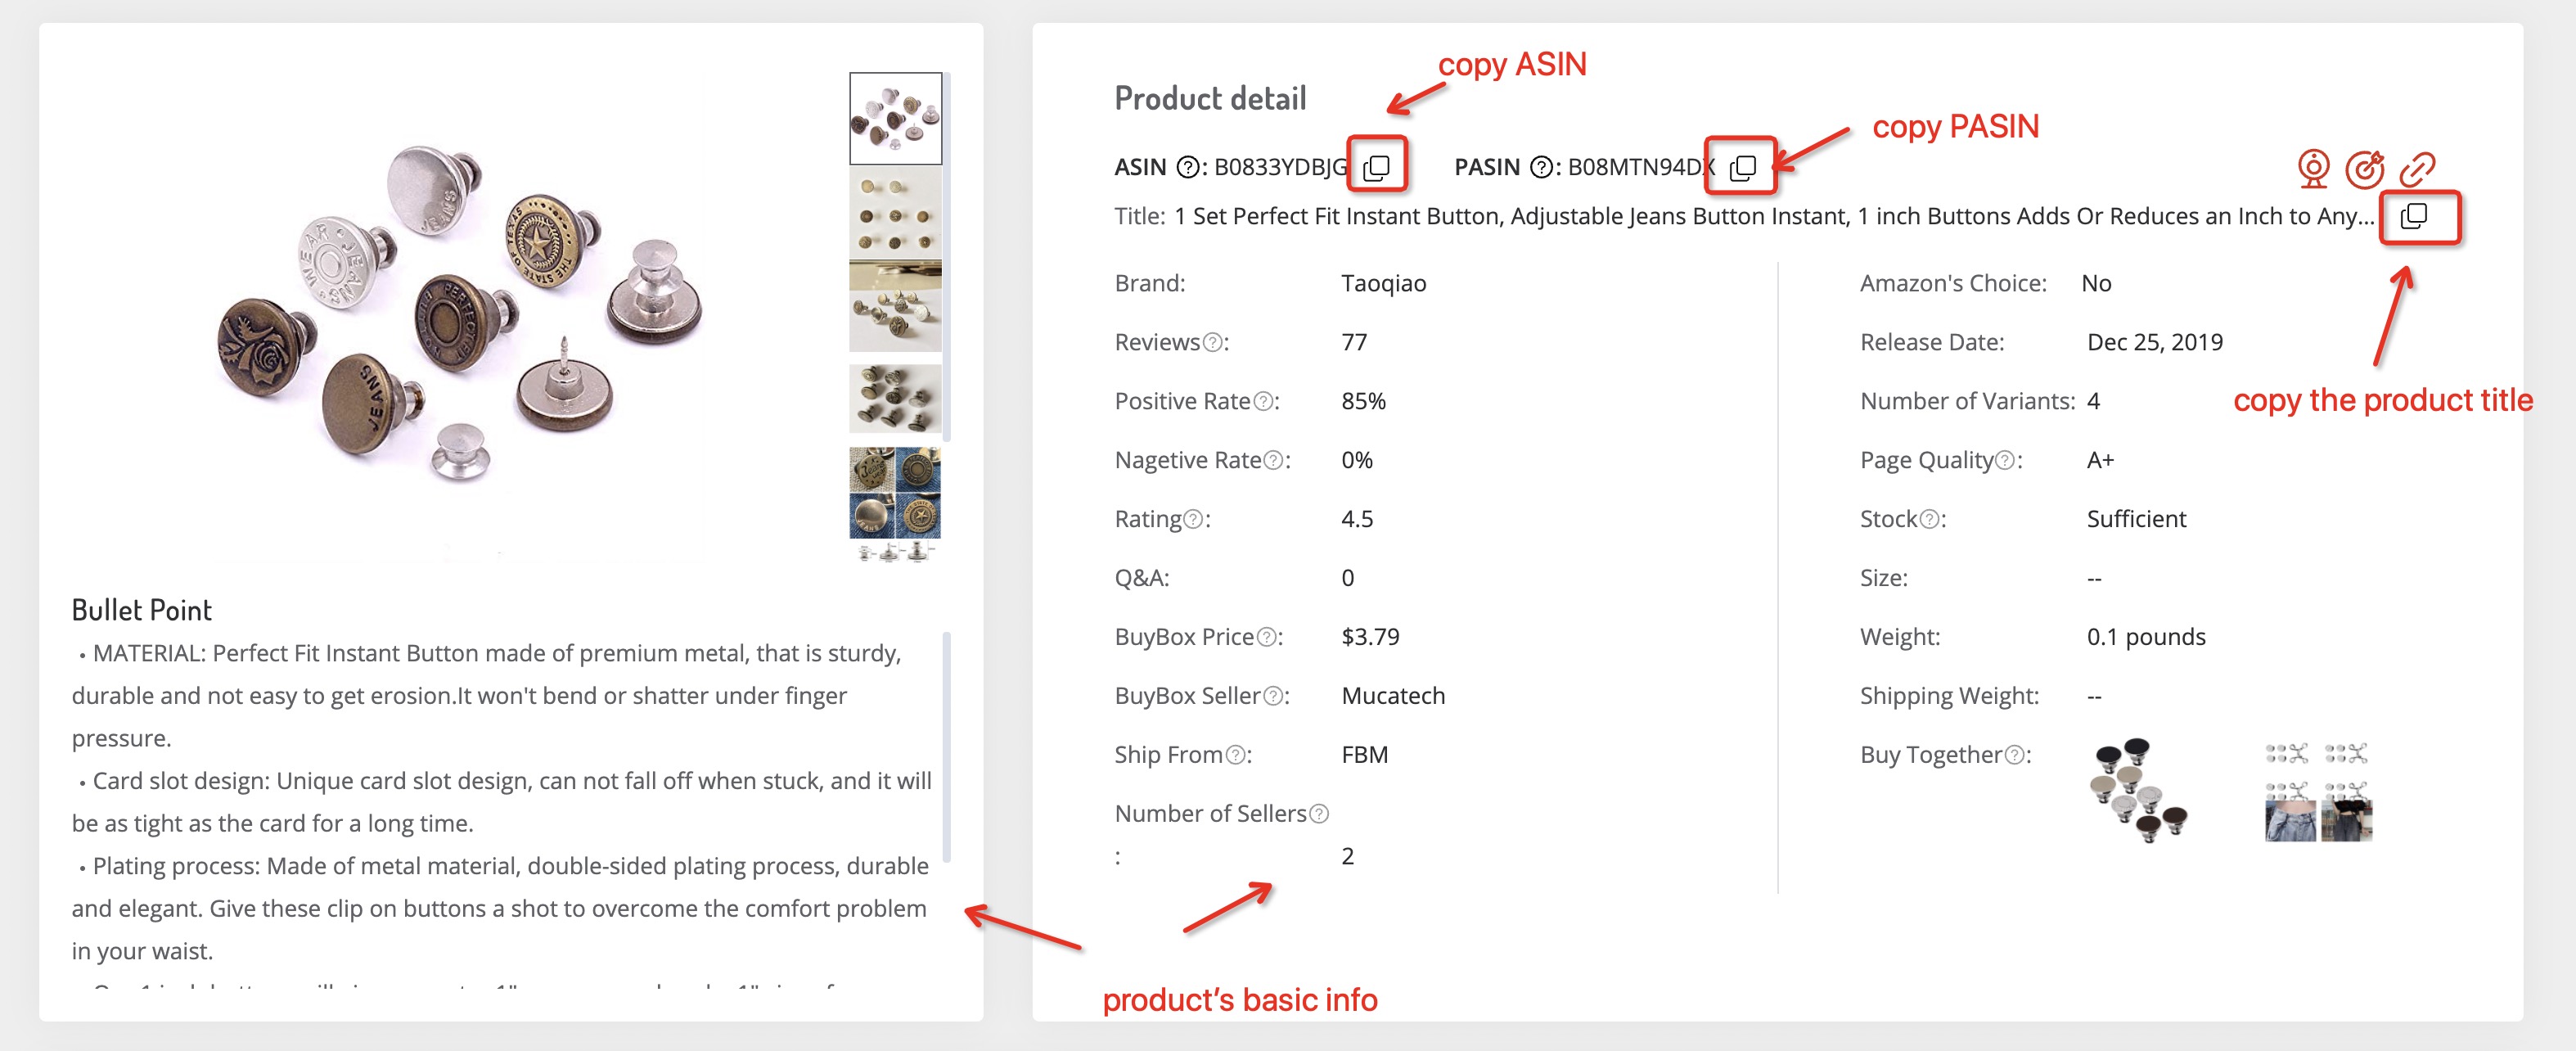
1.2.3.2 The three red icons in the upper right corner have different functions. By clicking the “product tracking” icon, you can add this product to your tracking database. While clicking the “keyword scout” icon, it will link to the keywords page regarding this ASIN. And when clicking the “Amazon details page” icon, it will link to the Amazon details page of this product.
Besides, it will link to another product details page if you click the product image in “Buy Together”.
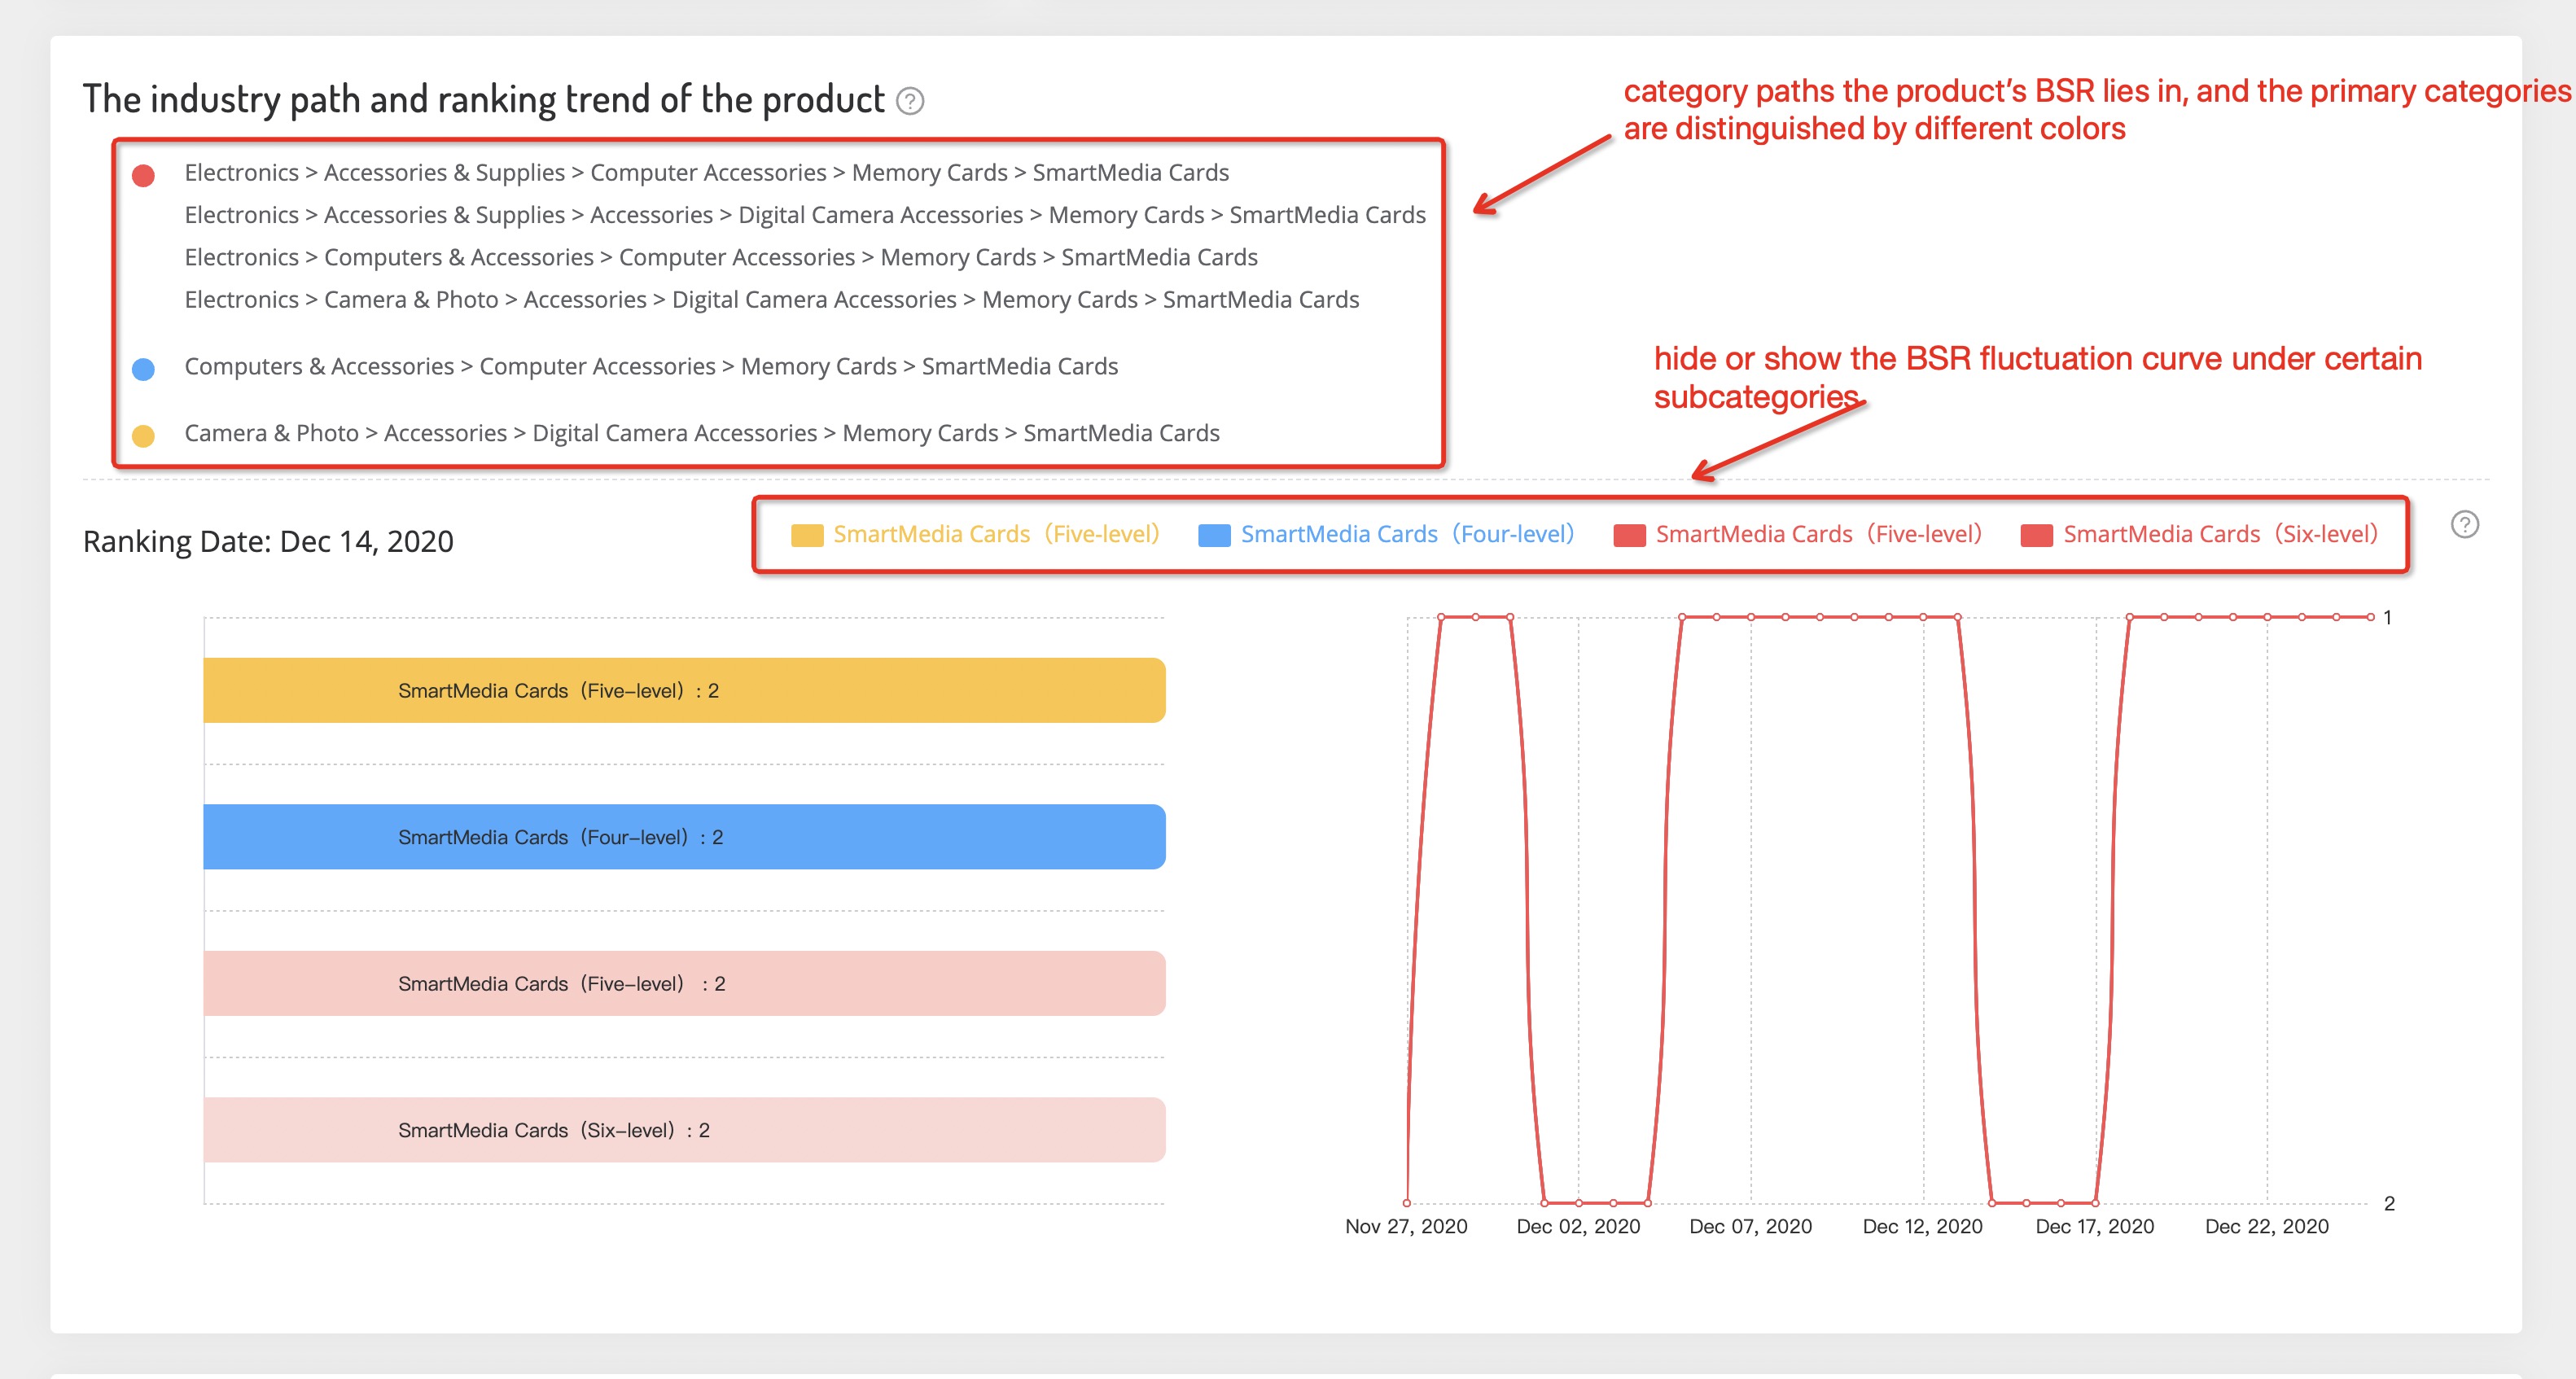
1.2.3.3 This section shows the category path of the product and the BSR trends in the past 30 days. In Amazon, one product could be launched in multiple different primary and sub-categories, so one product owns different category paths, and we distinguish these primary categories with different colors to better identify.
When you click any of the category names in the category paths, it will link to this category details analysis page. And the BSR fluctuation curve under the category could be hidden or shown by clicking this category name above the BSR fluctuation curve. Also, when moving your mouse on the BSR curve, you can have all the details of the fluctuations in BSR in the past 30 days.
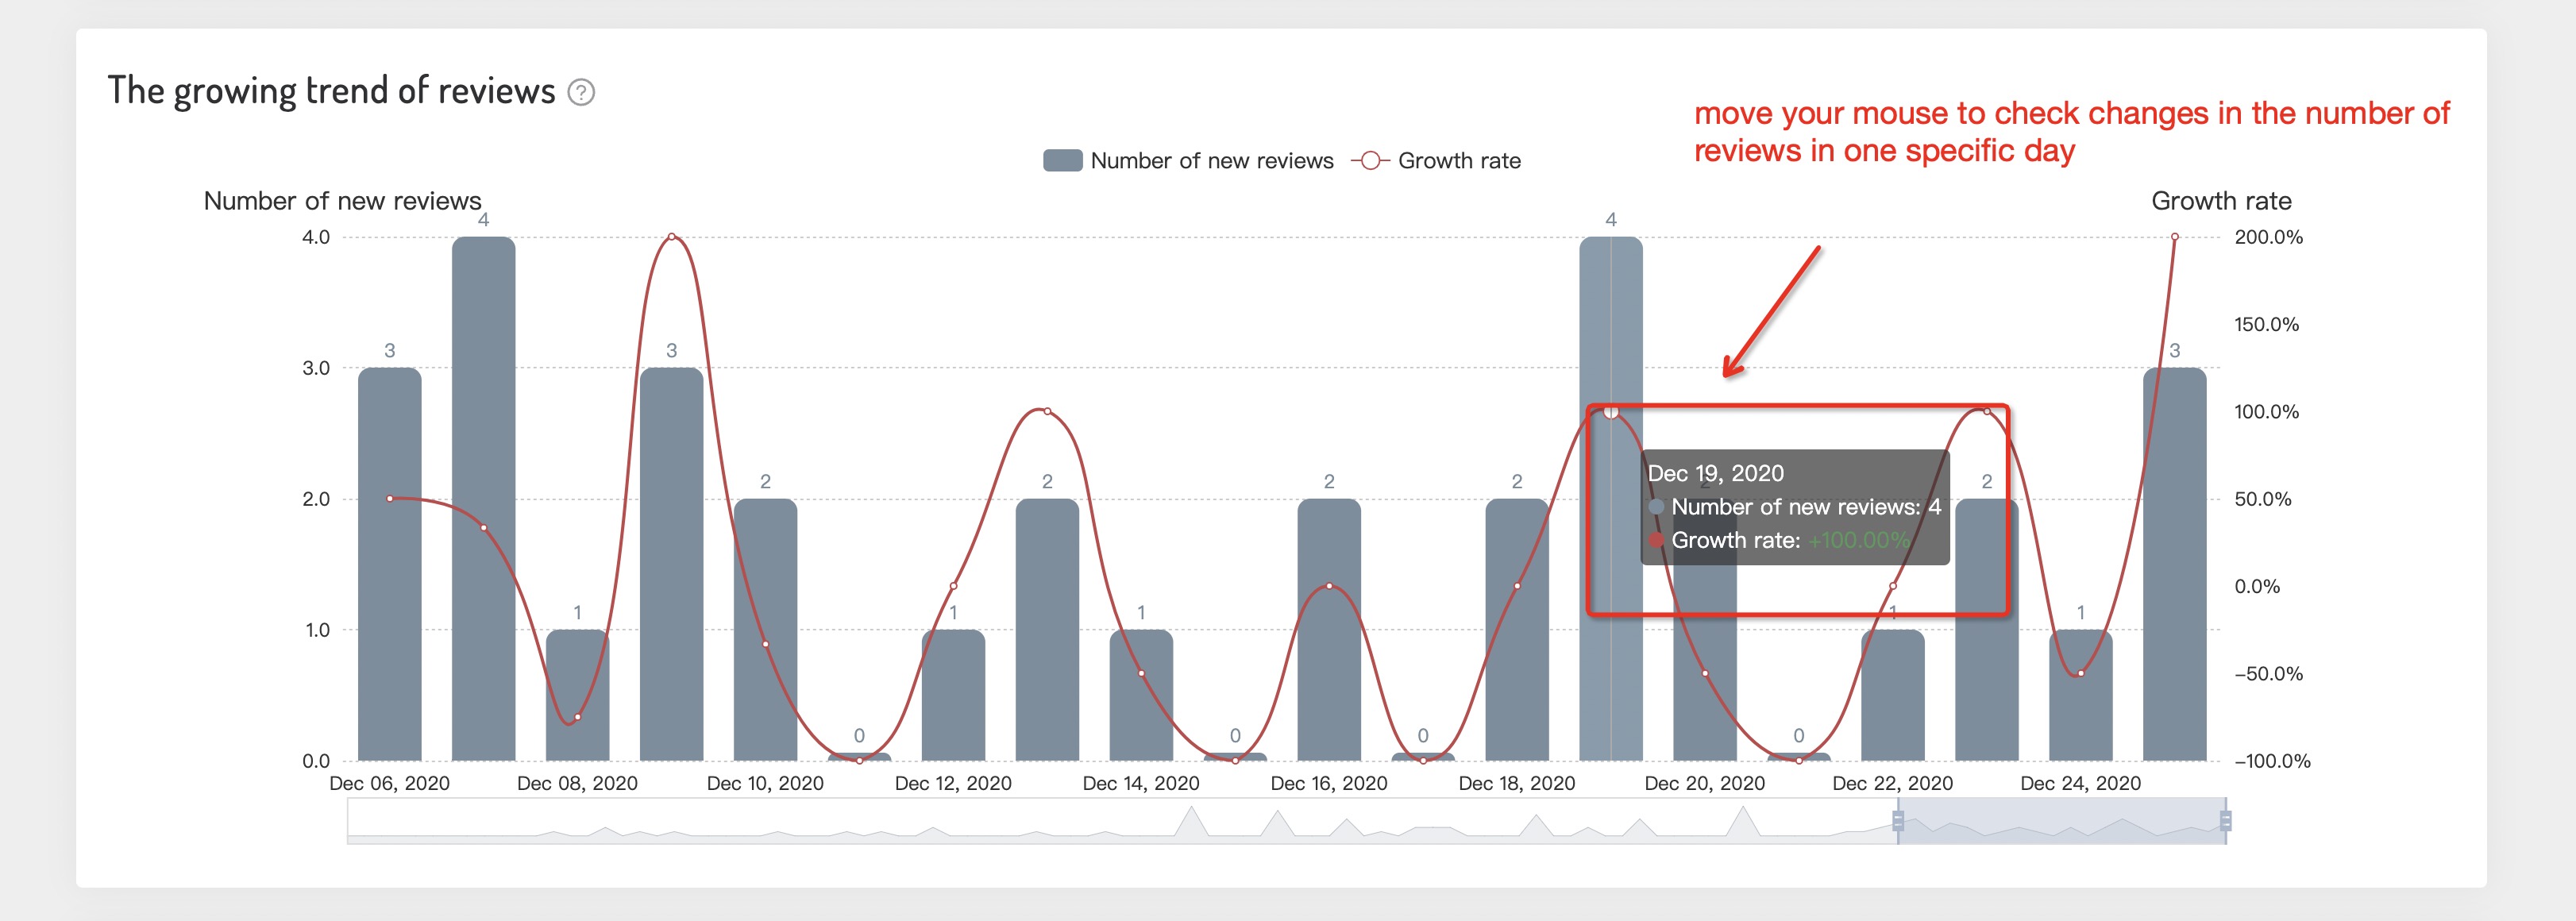
1.2.3.4 The growing trend of reviews shows the number of daily new reviews of this product and the trend of newly added reviews.
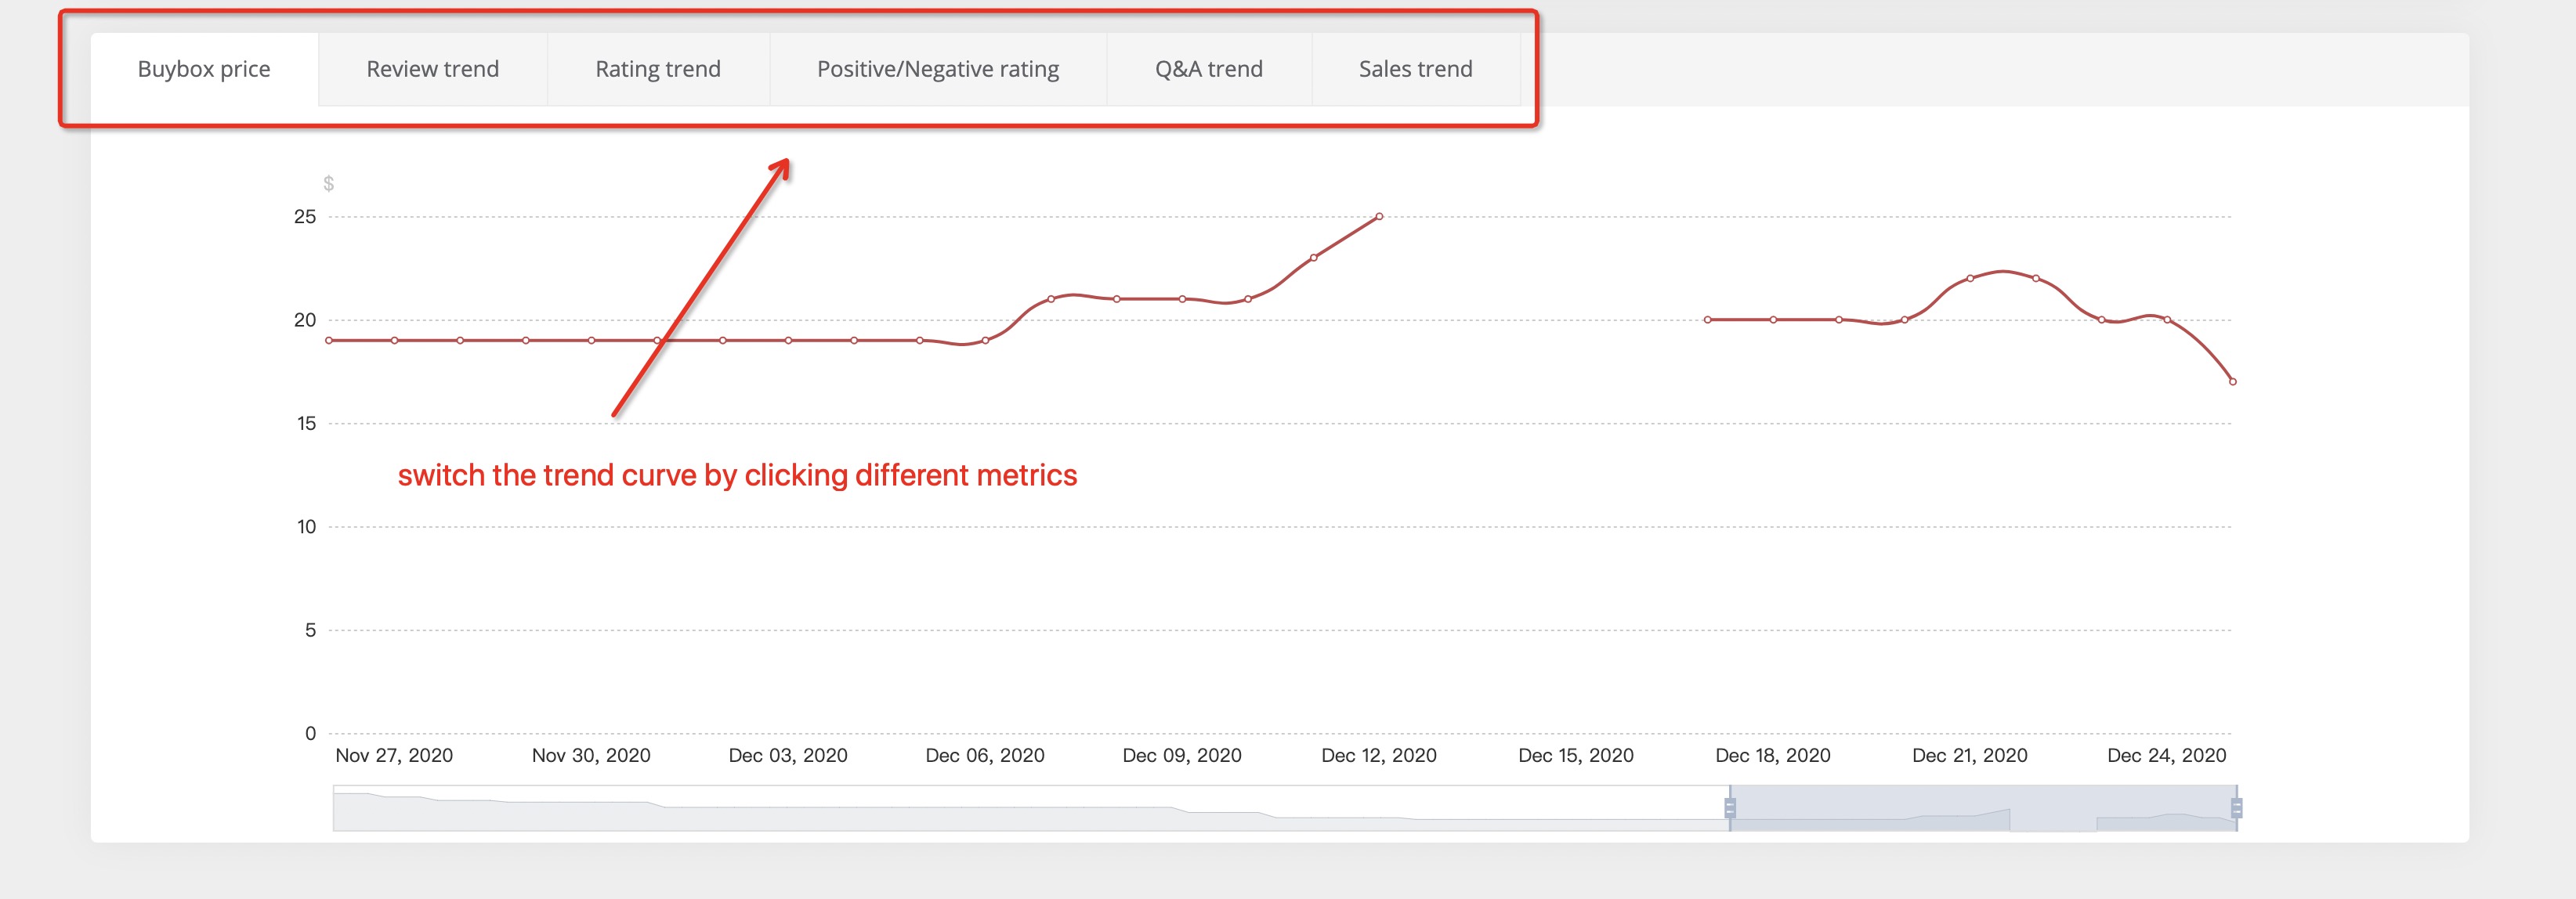
1.2.3.5 Check the historical changes in metrics of this product such as Buybox price, review trend, rating trend, positive/negative rating, Q/A trend, and sales trend.
2. Market Insight
2.1 Market Research
2.1.1 Usage Scenario
All Amazon categories except some specific categories containing ebooks, music, software, and movies are included in Market Insight. With this feature, you can analyze primary categories & subcategories from different perspectives to dig out potential categories and discover the best category path for your products. Moreover, you could find the low and peak seasons of the products to make sales plan in advance.
2.1.2 Data Sources
The category data presented on Market Insight are powered by our powerful database, it updates daily, and the updates will be displayed on AmzChart in real-time.
2.1.3 Introduction to Functions
2.1.3.1 Select the Amazon marketplace first (now only the US marketplace available), input category keywords in the search bar, then set filter criteria based on your preferences below the search bar, click “search” or press the Enter key to start searching. Then you will get a long list of category results that meet your requirements.
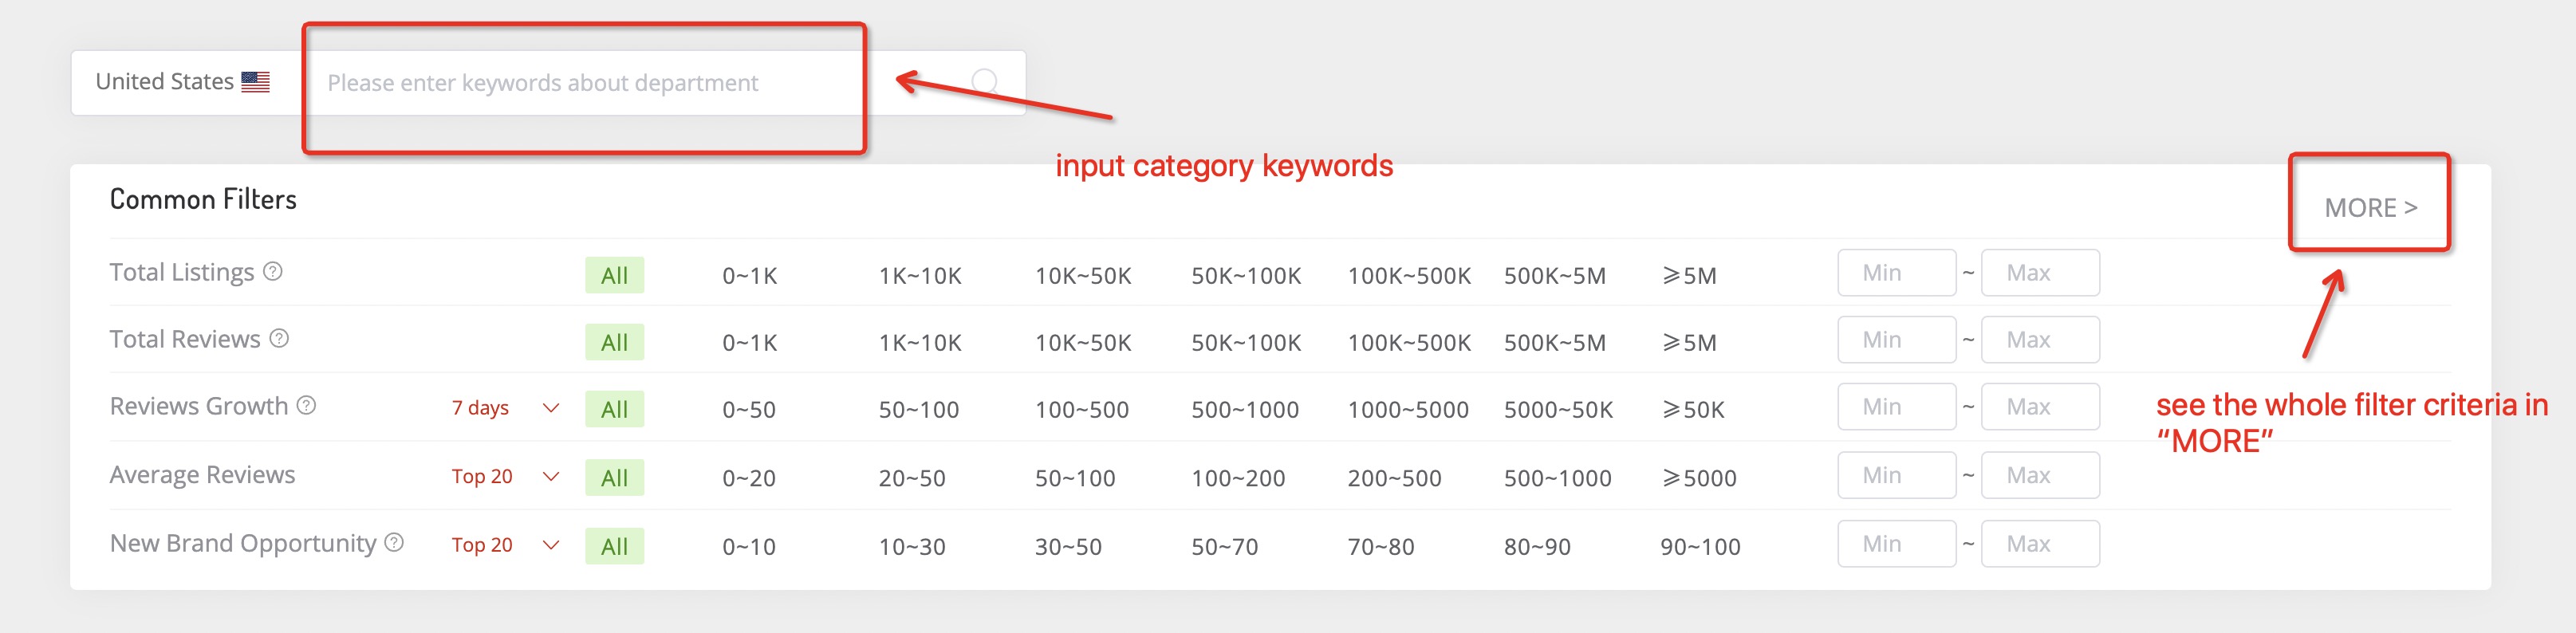
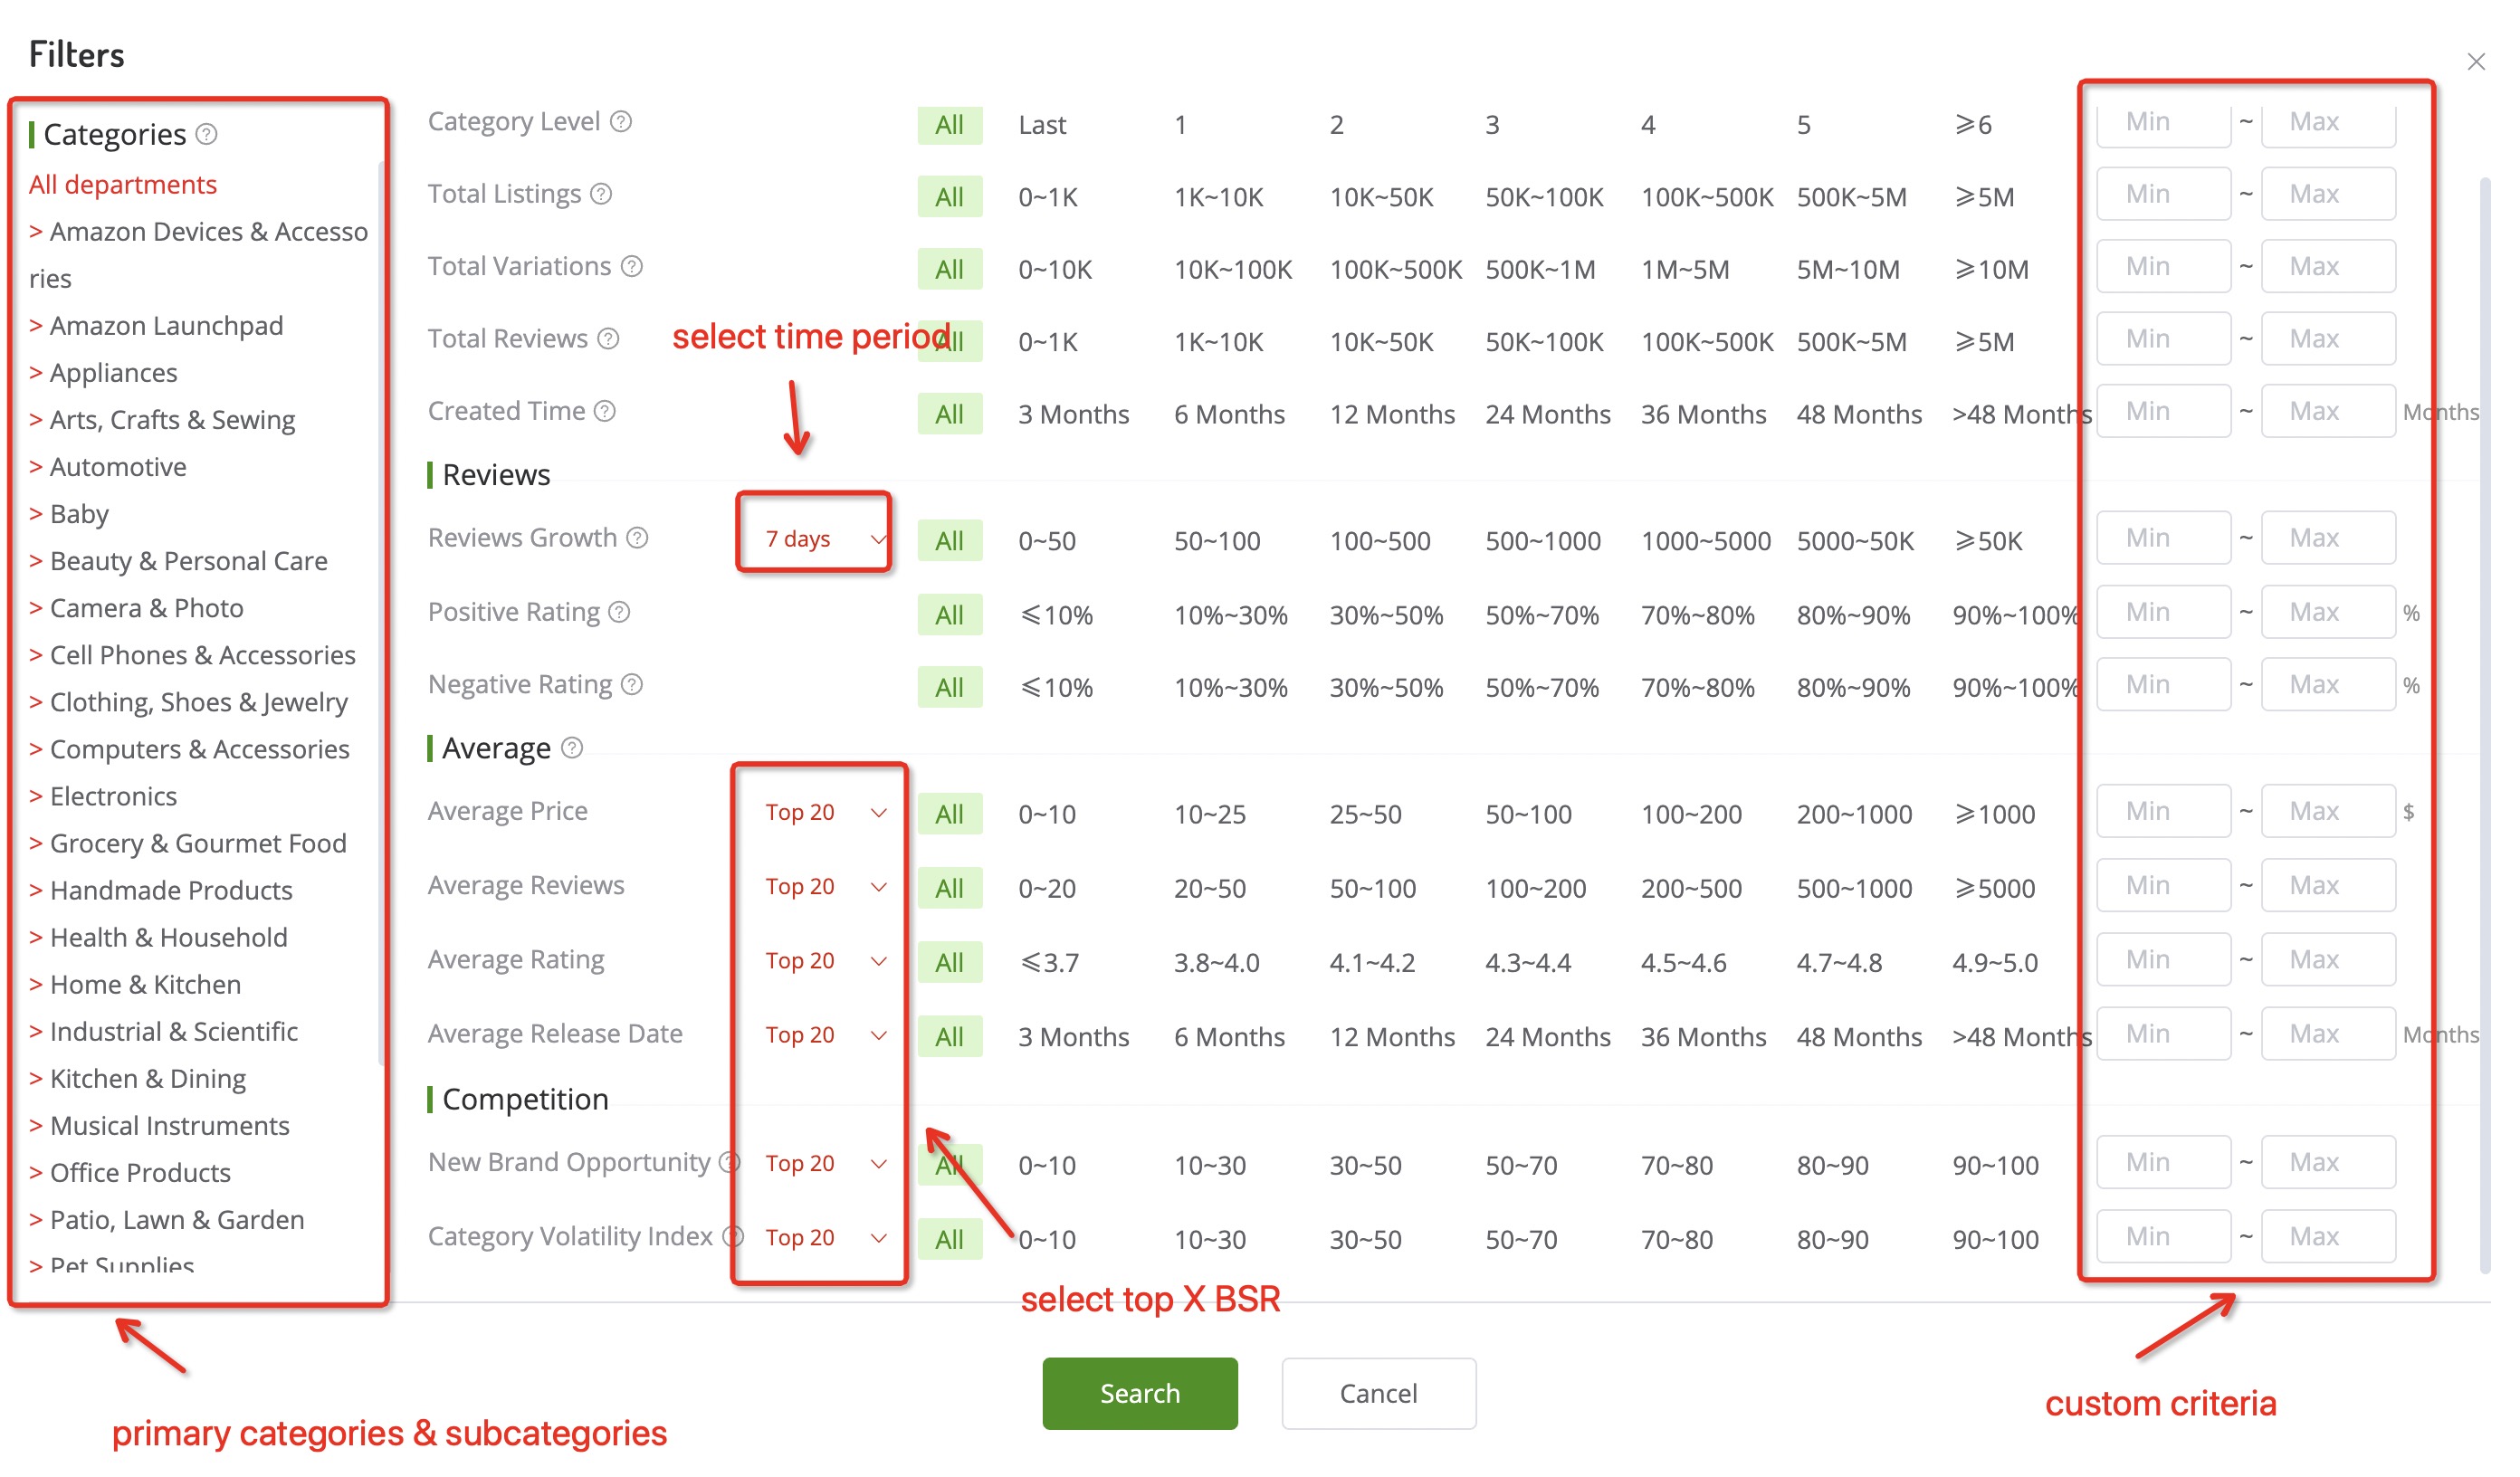
2.1.3.2 Click “MORE” in the upper right corner of the filter section to get comprehensive filter criteria, and you can add detailed filter criteria such as categories, time period, number of listings, etc., to filter out the more precise categories that meet your needs.
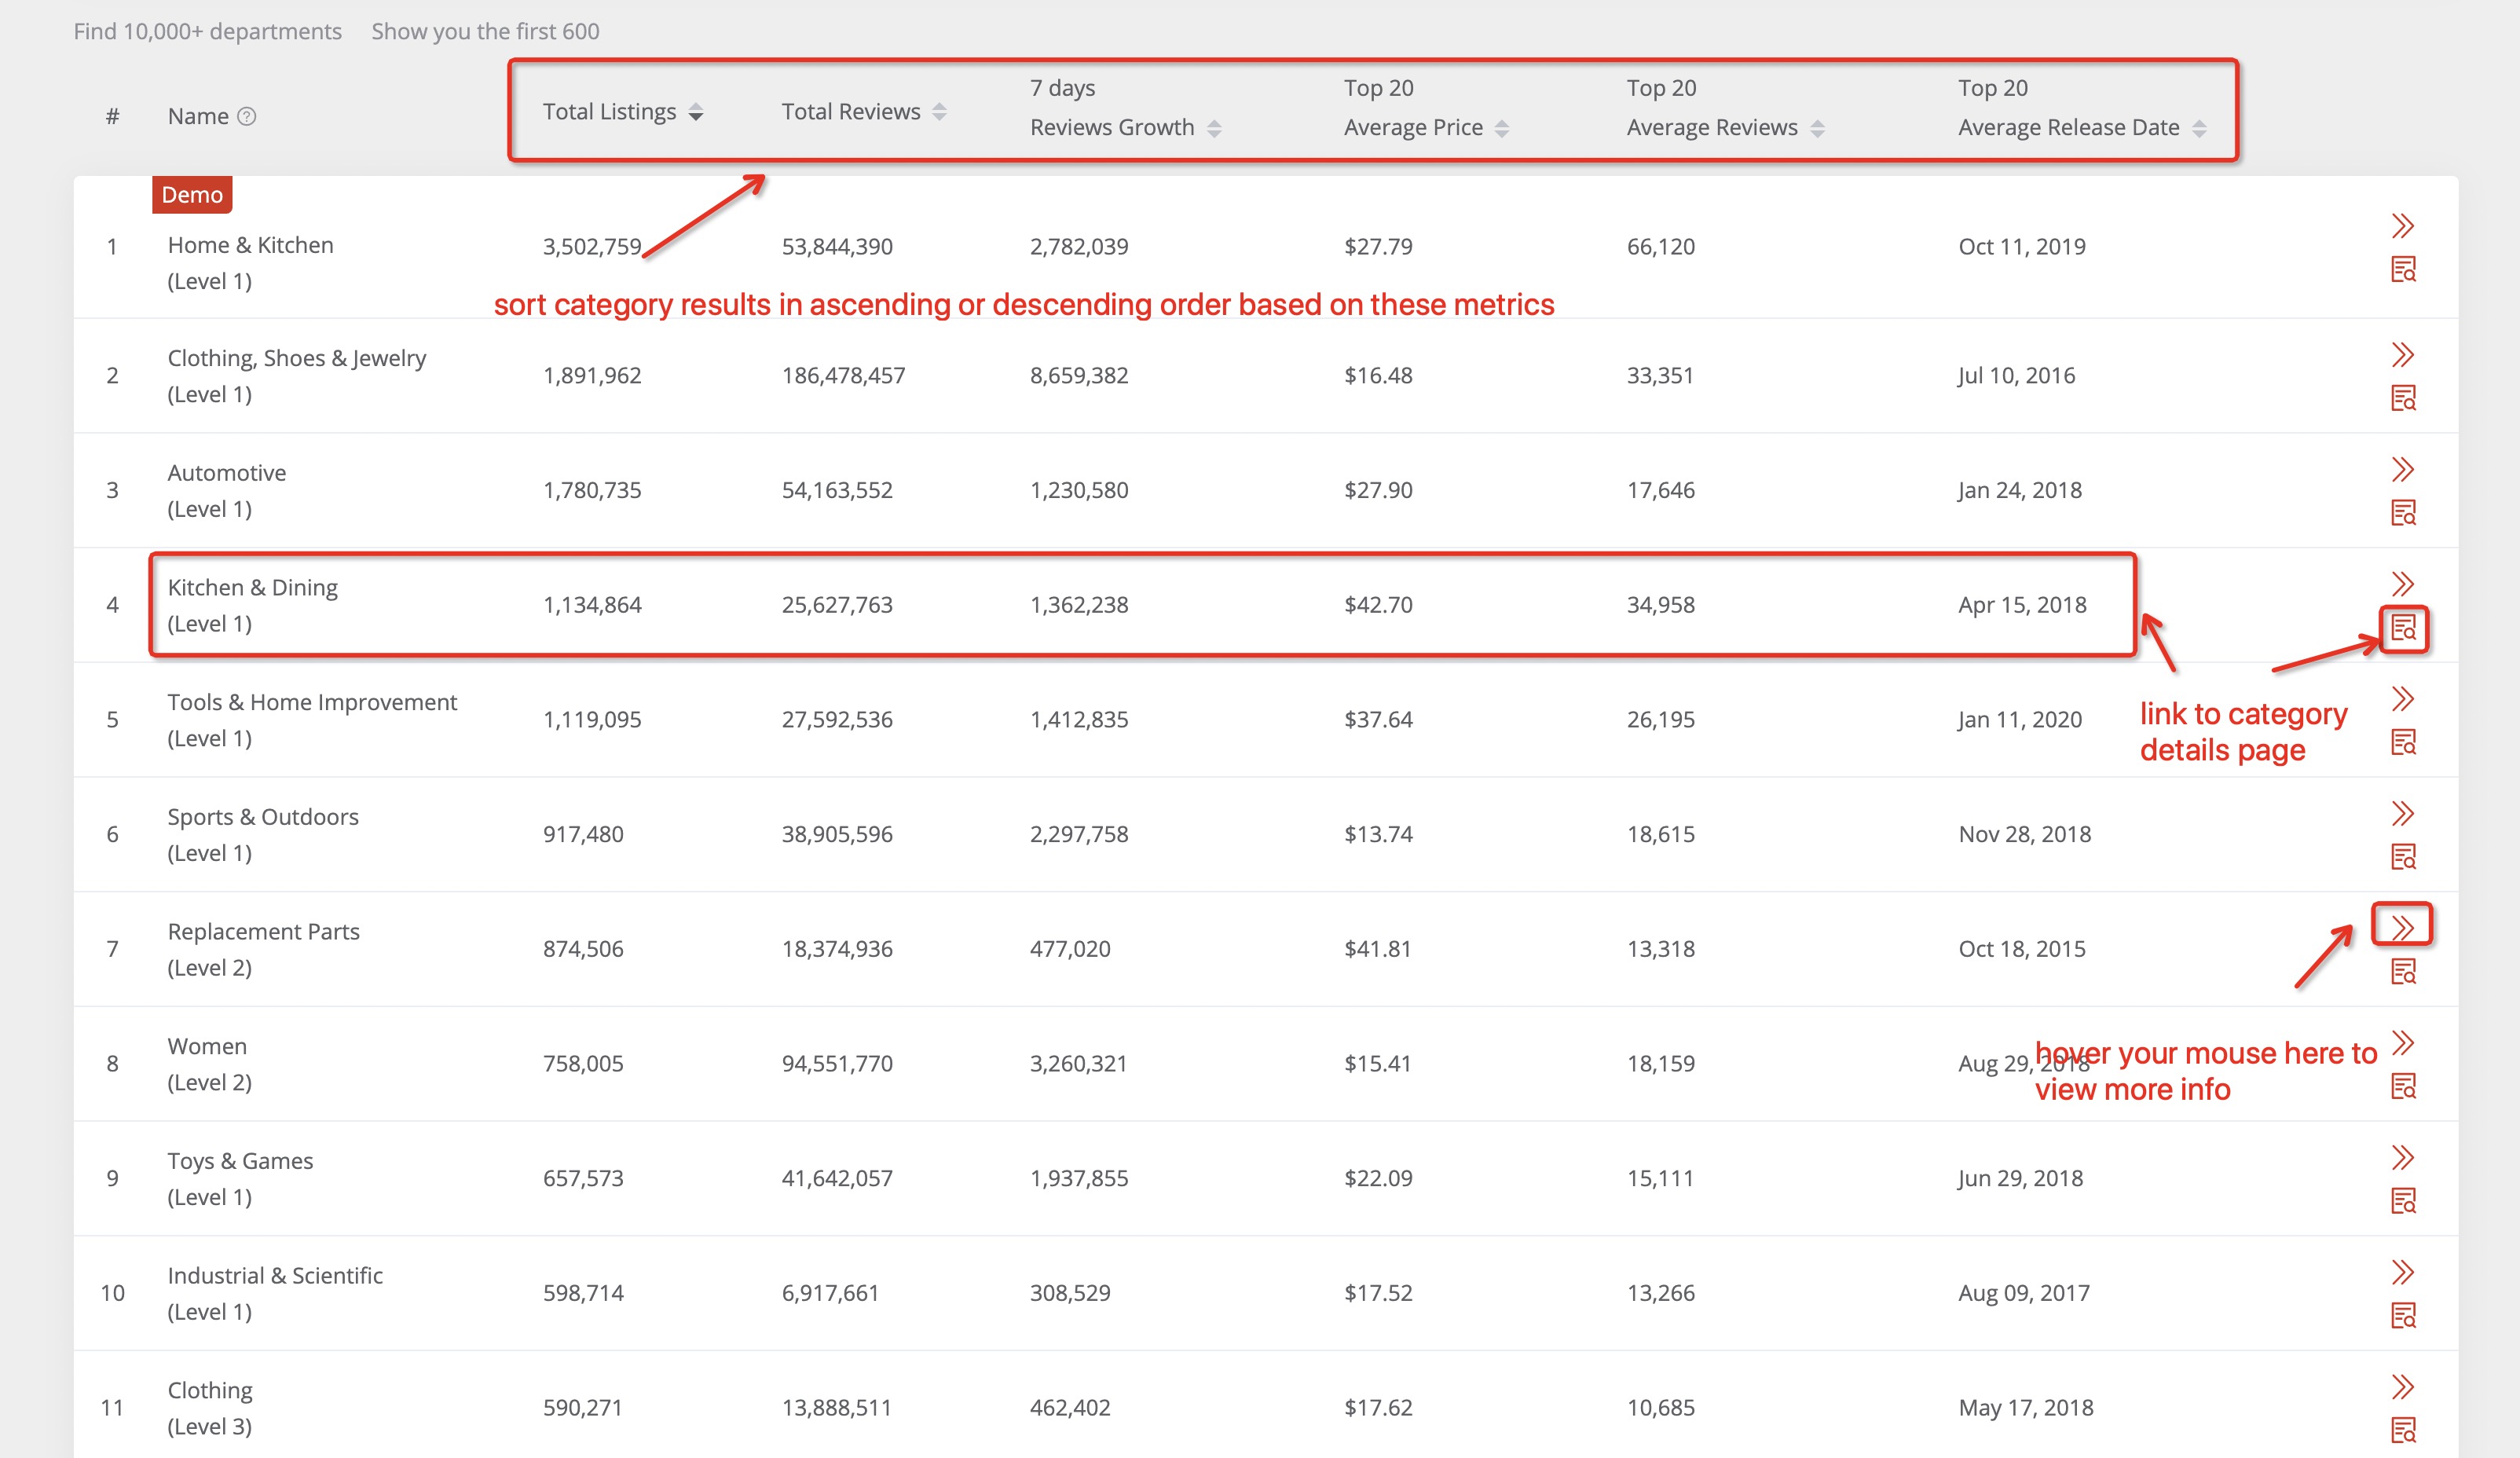
2.1.3.3 After searching, you will get a long list of category results, and they can be sorted in ascending or descending order based on total listings, total reviews, X days reviews growth, as well as top X products’ average price, reviews and release date. When clicking the category, it will link to the category’s details page.
2.2 Category Details Analysis
2.2.1 Usage Scenario
After selecting one specific category in the category searching page, it will link to the category details page to get more details regarding this category, where you can compare and contrast more data on this page and determine whether this category is good for your products.
2.2.2 Data Sources
The category details data presented on Market Insight are powered by our powerful database, it updates daily, and the updates will be displayed on AmzChart in real-time.
2.2.3 Feature 1: Category Comprehensive Analysis
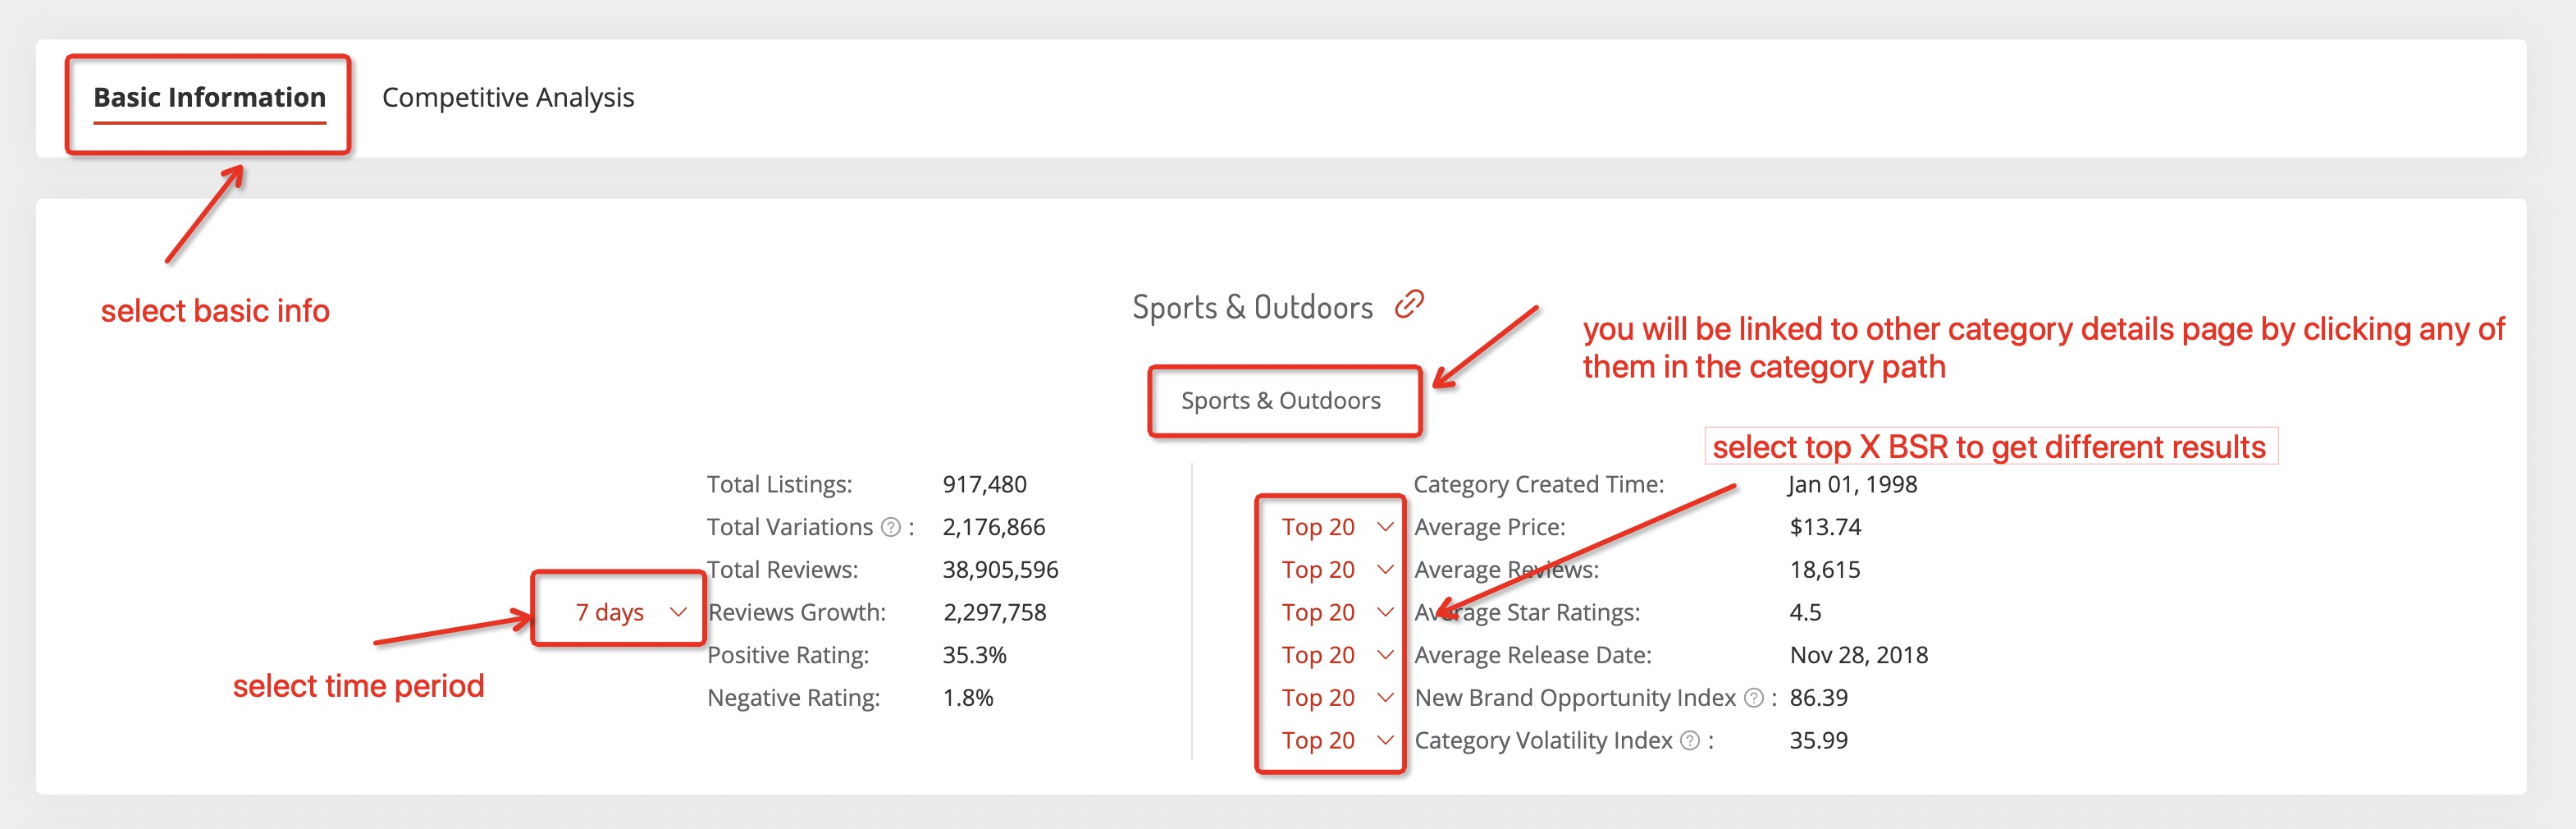
2.2.3.1 Basic Information
Category Comprehensive Analysis contains the basic info of the category. And you can check the corresponding categories by clicking any of them in the category paths. Furthermore, you can check the corresponding data by switching the period or top x BSR’s number.
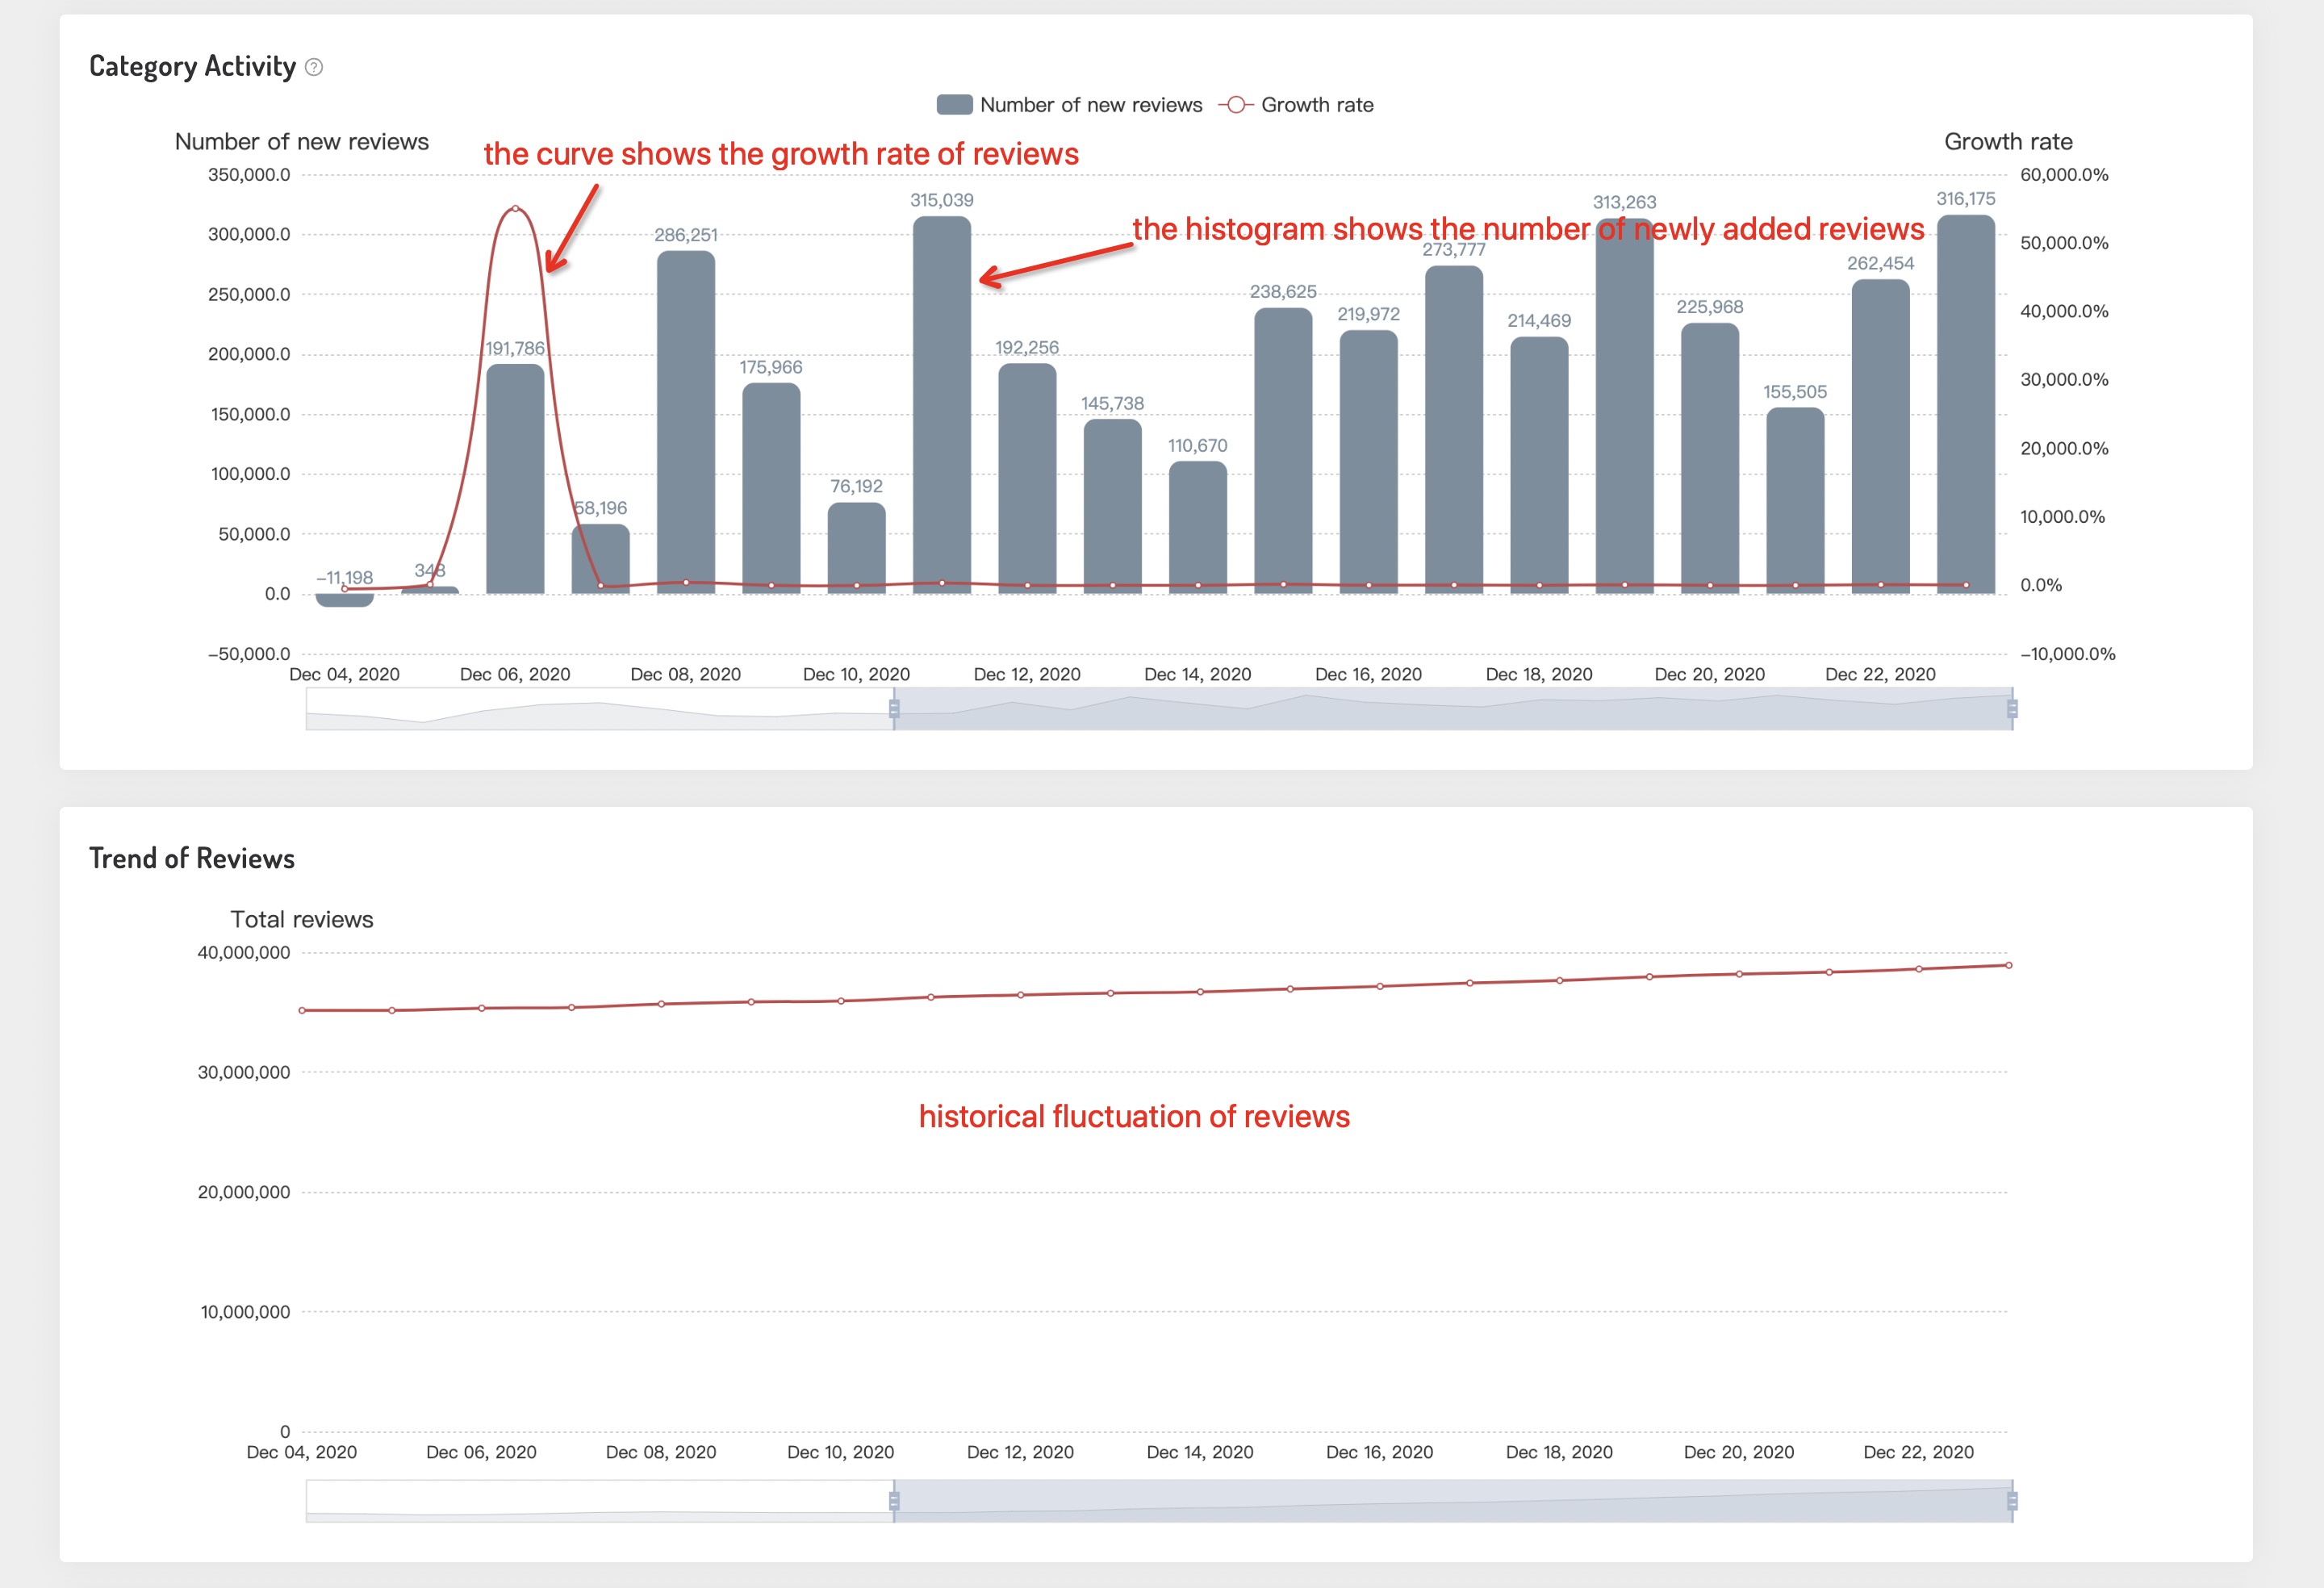
2.2.3.2 Category Activity & Trend of Reviews
Category Activity reveals the connection between the number of newly added reviews and the growth rate of reviews. We can see the category‘s activity by analyzing the growth of reviews under this category. The greater the increase in reviews, the better the activity of the category.
And the trend of reviews explains the historical fluctuation of reviews under this category.
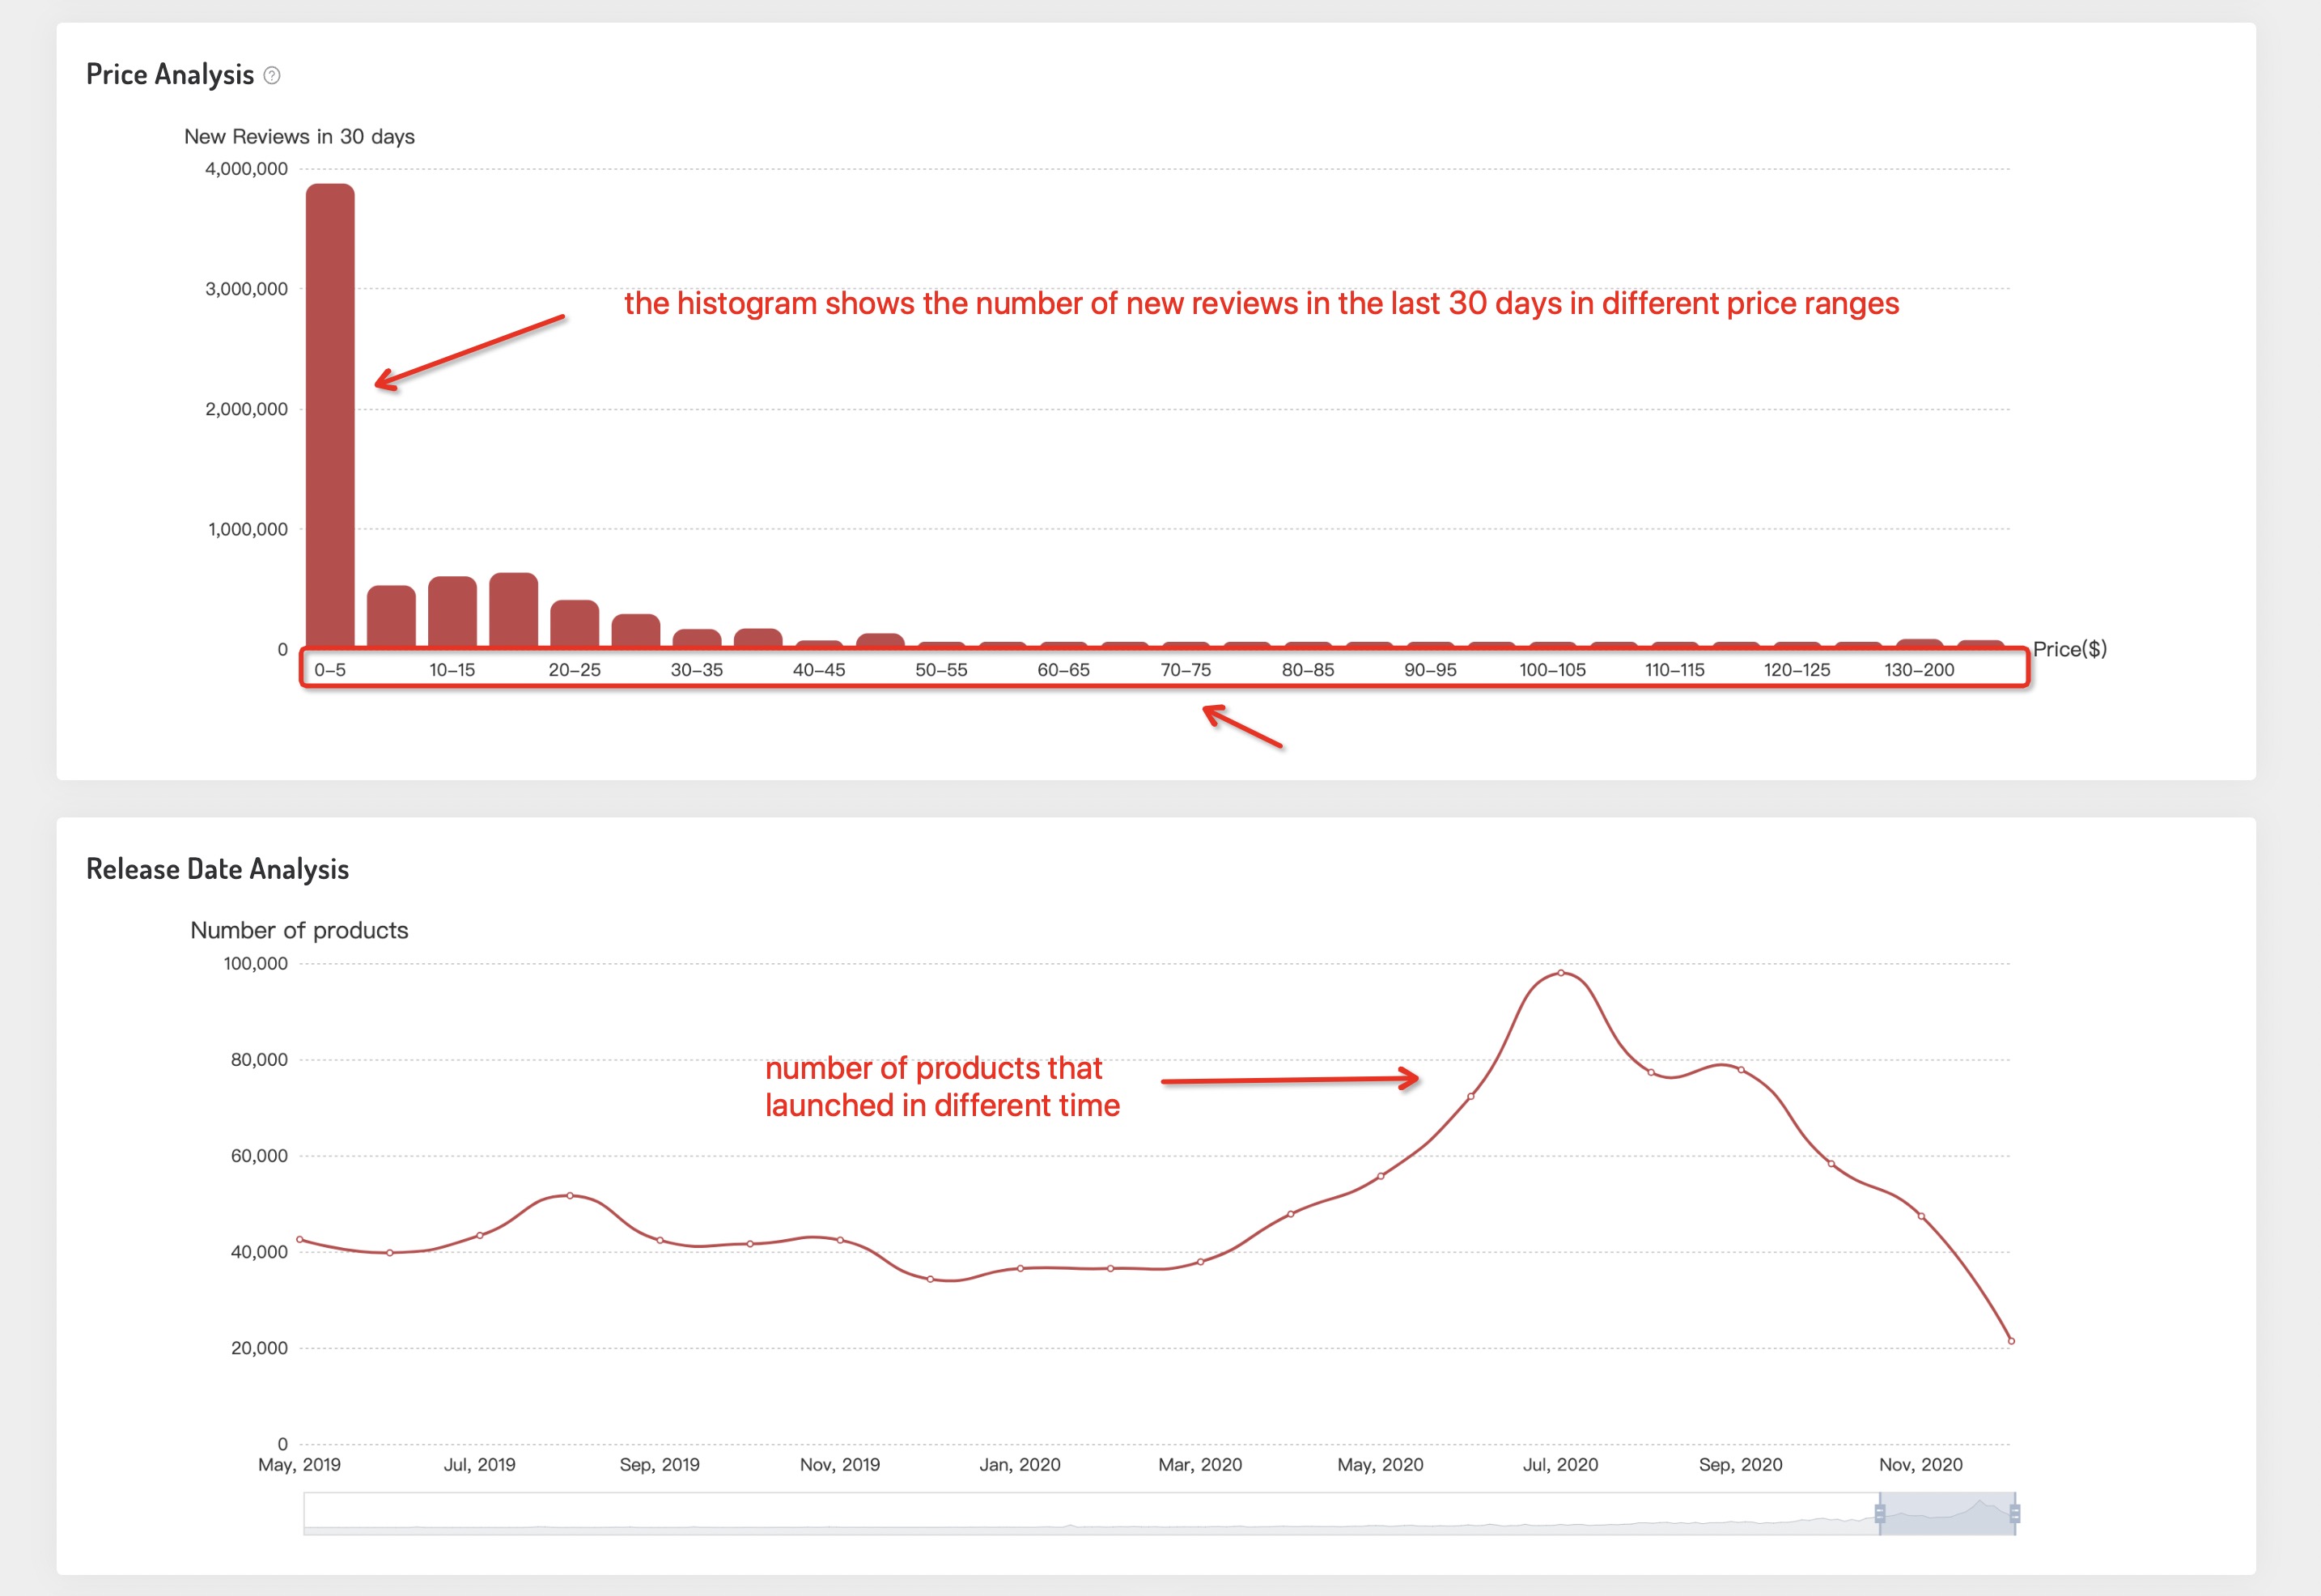
2.2.3.3 Price Analysis & Release Date Analysis
By investigating the relation between prices and reviews, we could know the distribution of different products’ prices in this category, and better price our products.
The release date analysis illustrates the numbers of products that launched in different time periods, aiming to analyze the new product trends of this category.
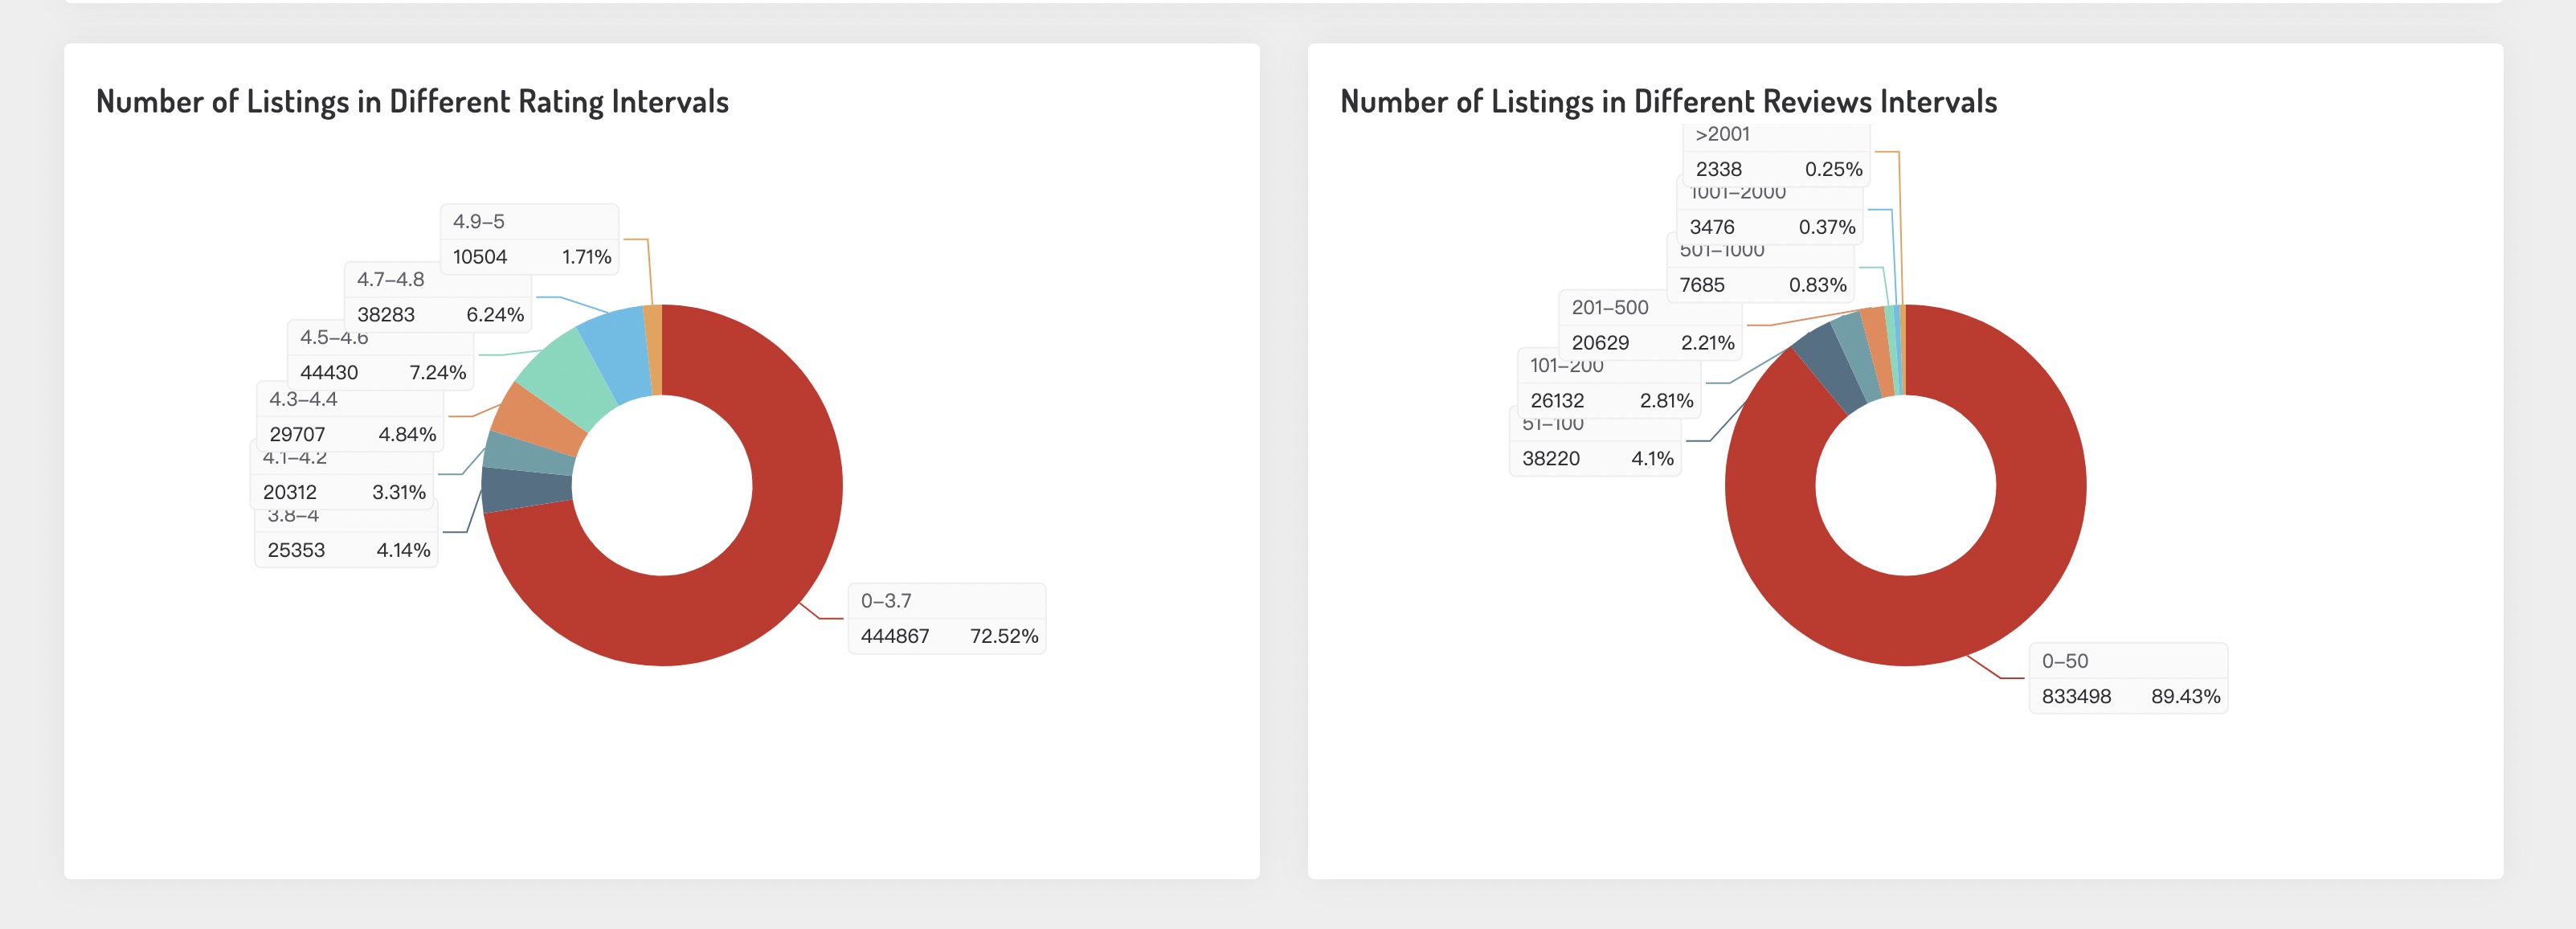
2.2.3.4 Number of Listings Analysis
As these two images stand below, the left displays the number of listings in different rating intervals, the right illustrates the number of listings in different review intervals.
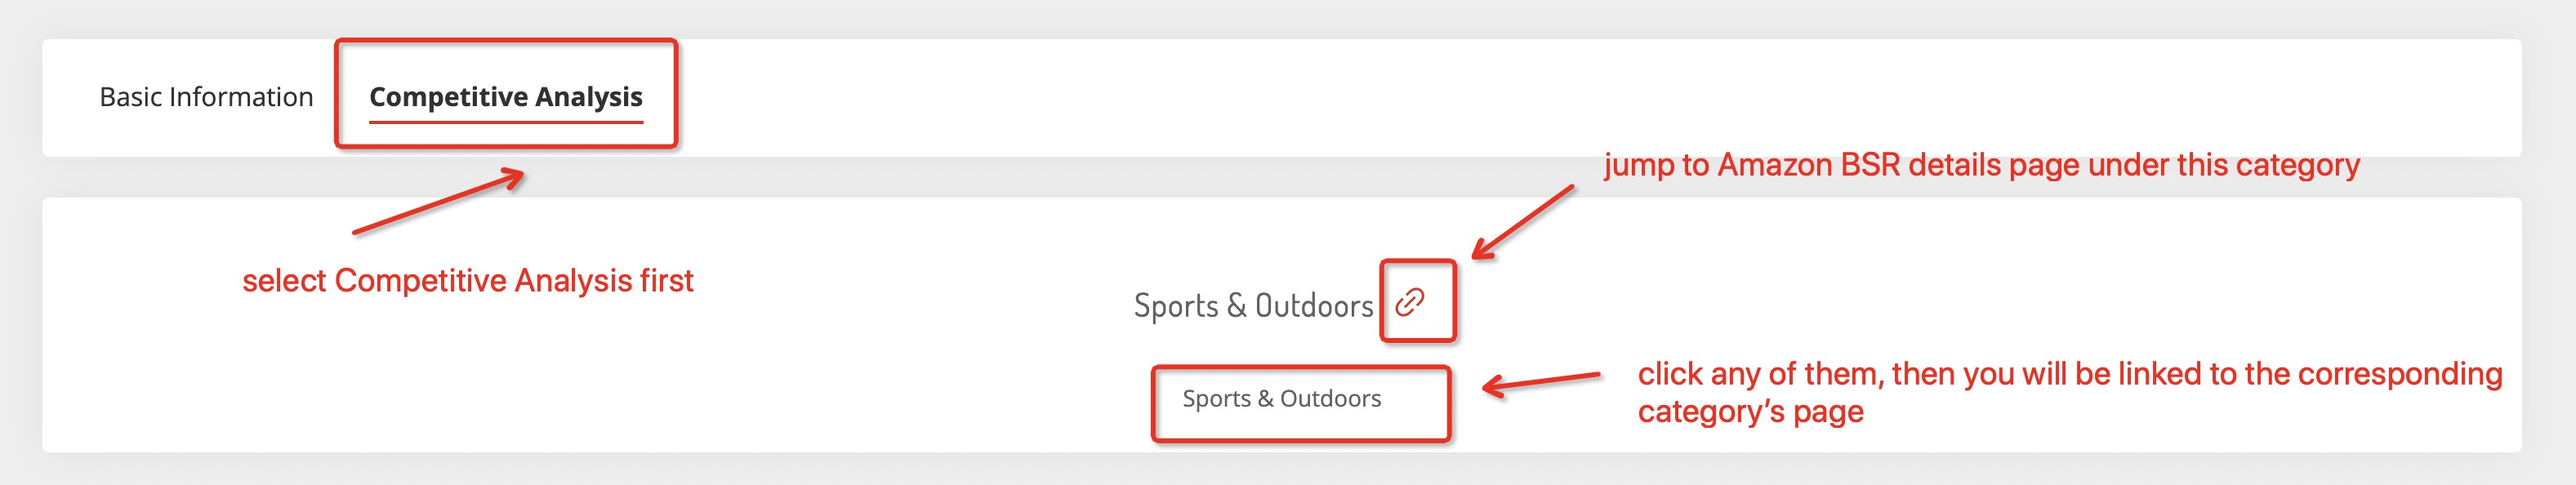
2.2.4 Feature 2: Category Competitive Analysis
2.2.4.1 Basic Information
Category Competitive Analysis presents category paths of this category, and you can check the corresponding categories by clicking any of them in the category paths. Also, you can click the “link” icon to jump to Amazon’s Best Sellers Rank page in this category.
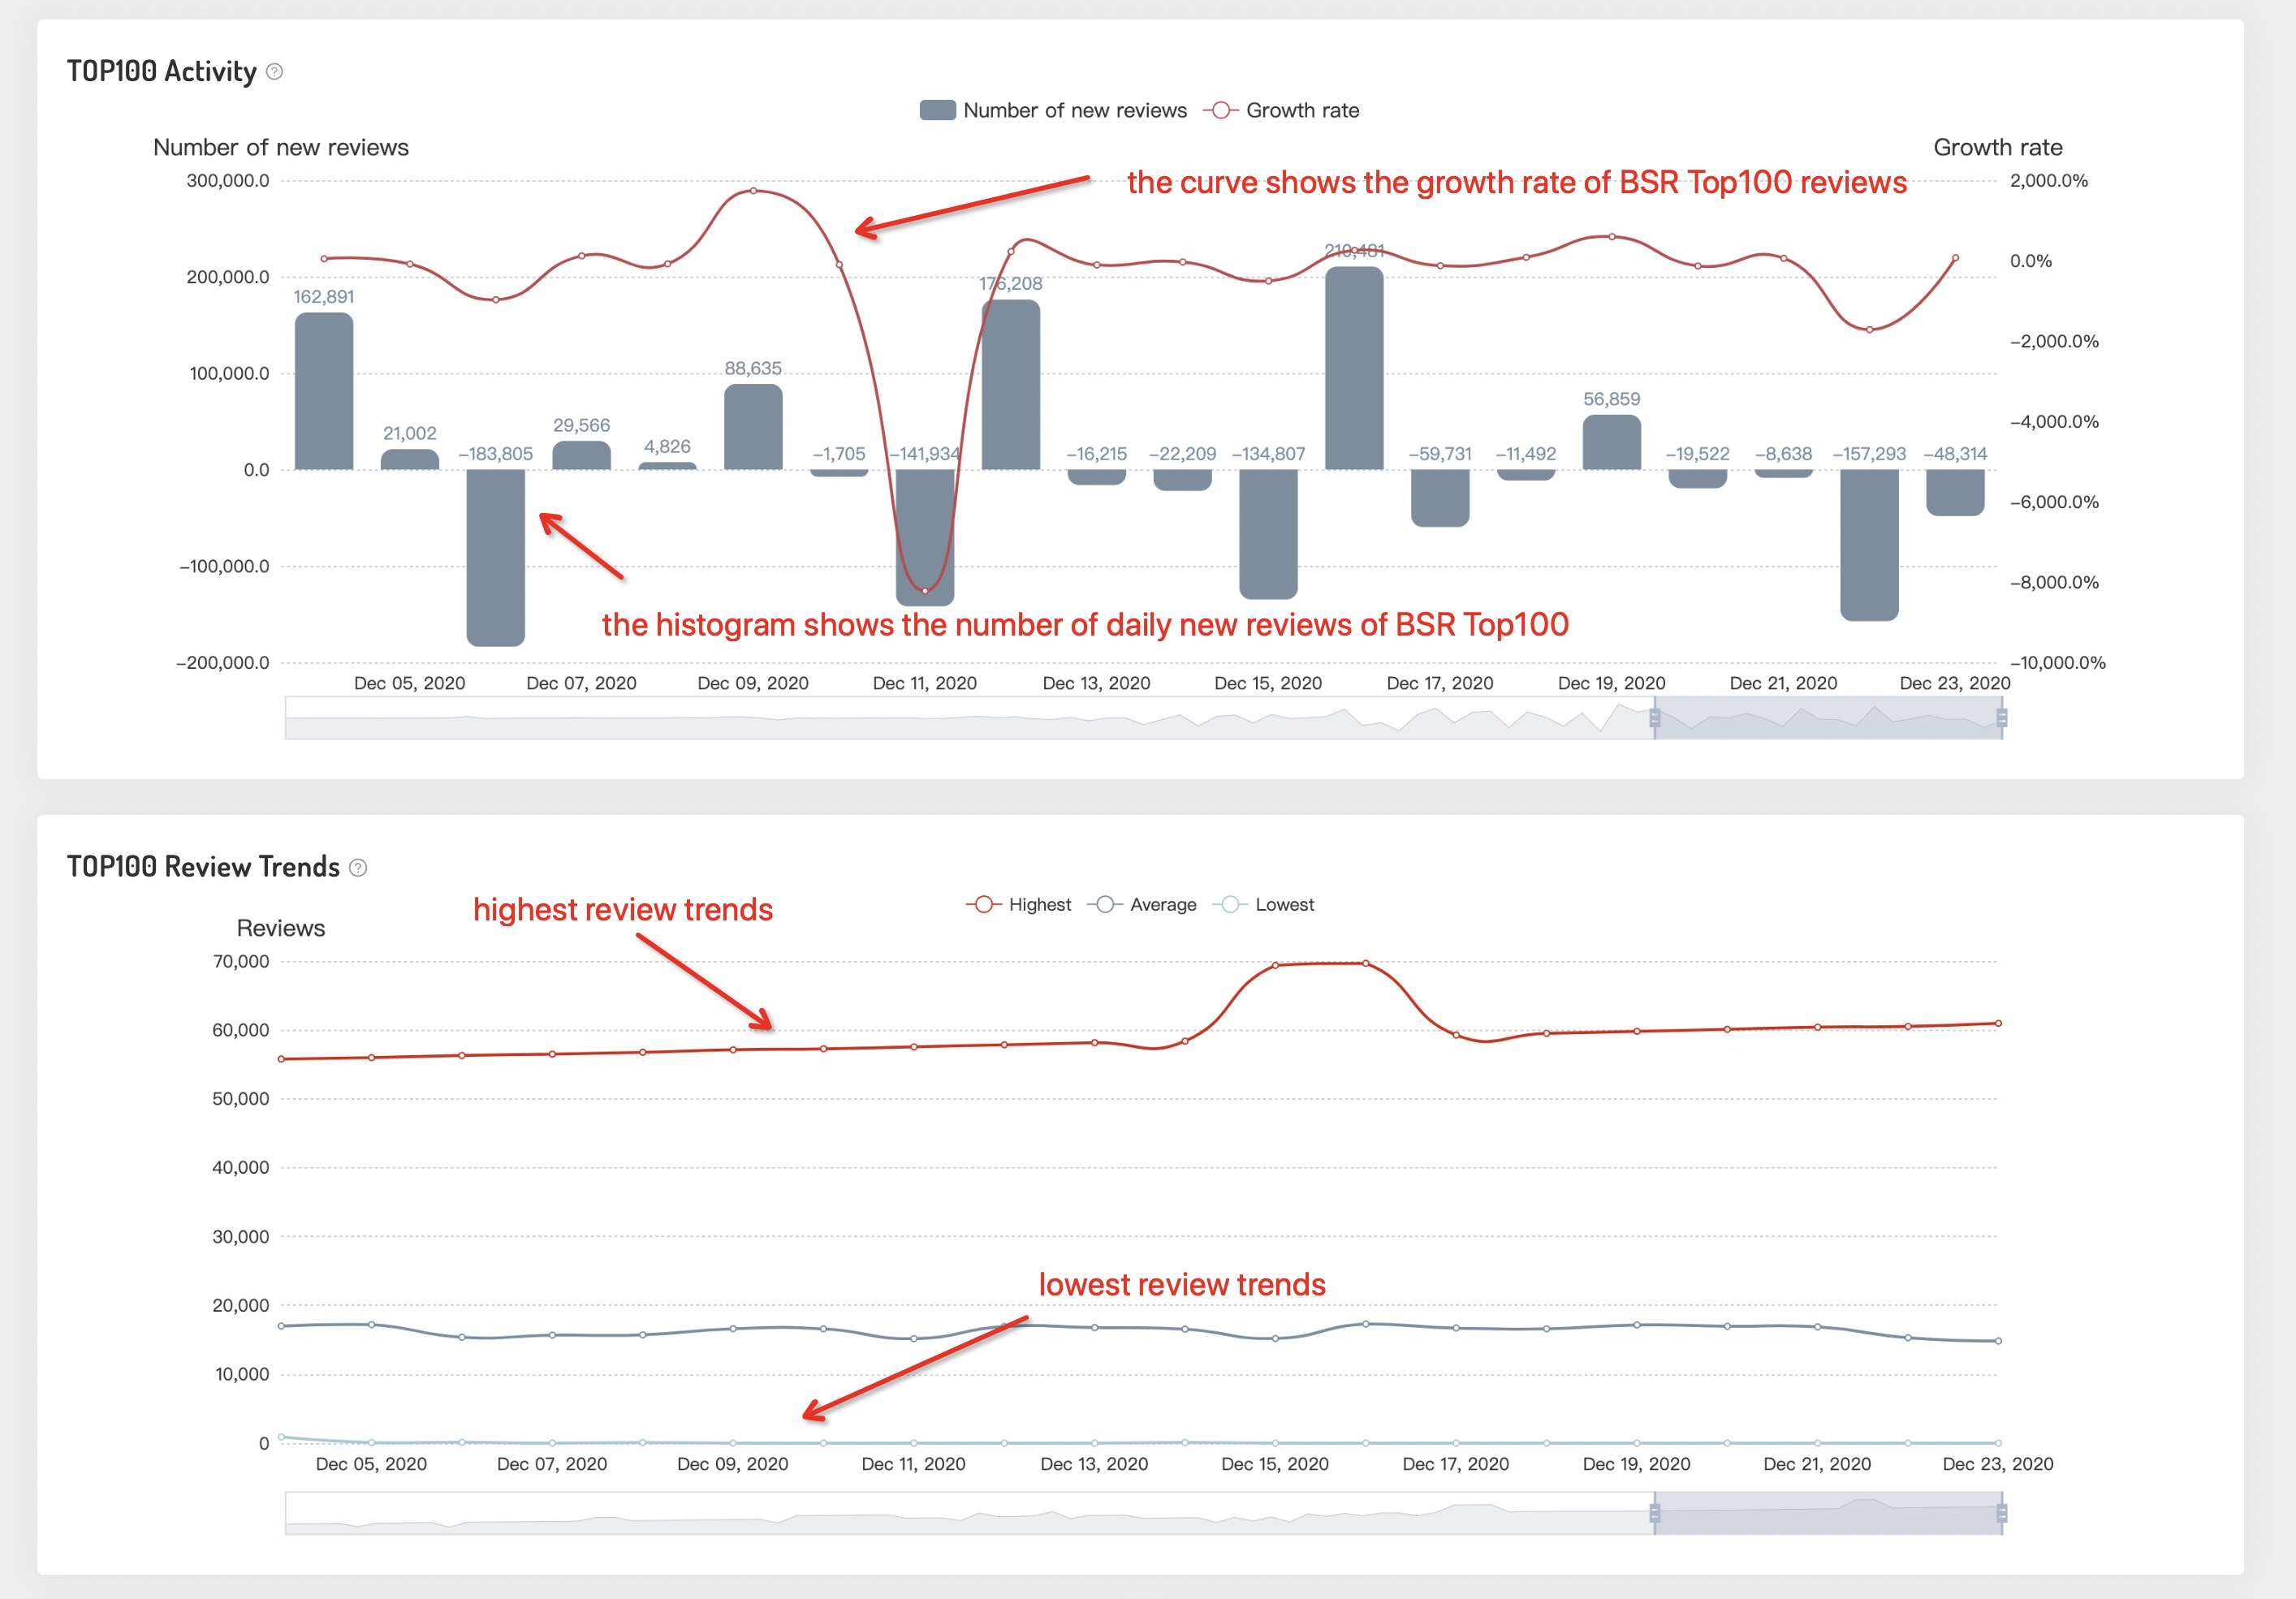
2.2.4.2 TOP100 Activity & TOP100 Review Trends
TOP100 Activity reveals the connection between the number of newly added reviews of Top100 BSR under this category and the growth rate of reviews. And the activity of the category can be judged by analyzing the review changes of the Top100 BSR in the category. The greater the number of reviews fluctuates, the more active the category.
TOP100 Review Trends demonstrates the trend of Top100 BSR’s historical reviews under the category. By analyzing the review trends of the Top100 BSR, we’ll have a better understanding of the traffic trends in this category, to know the difficulty of ranking in the top 100 in the category.
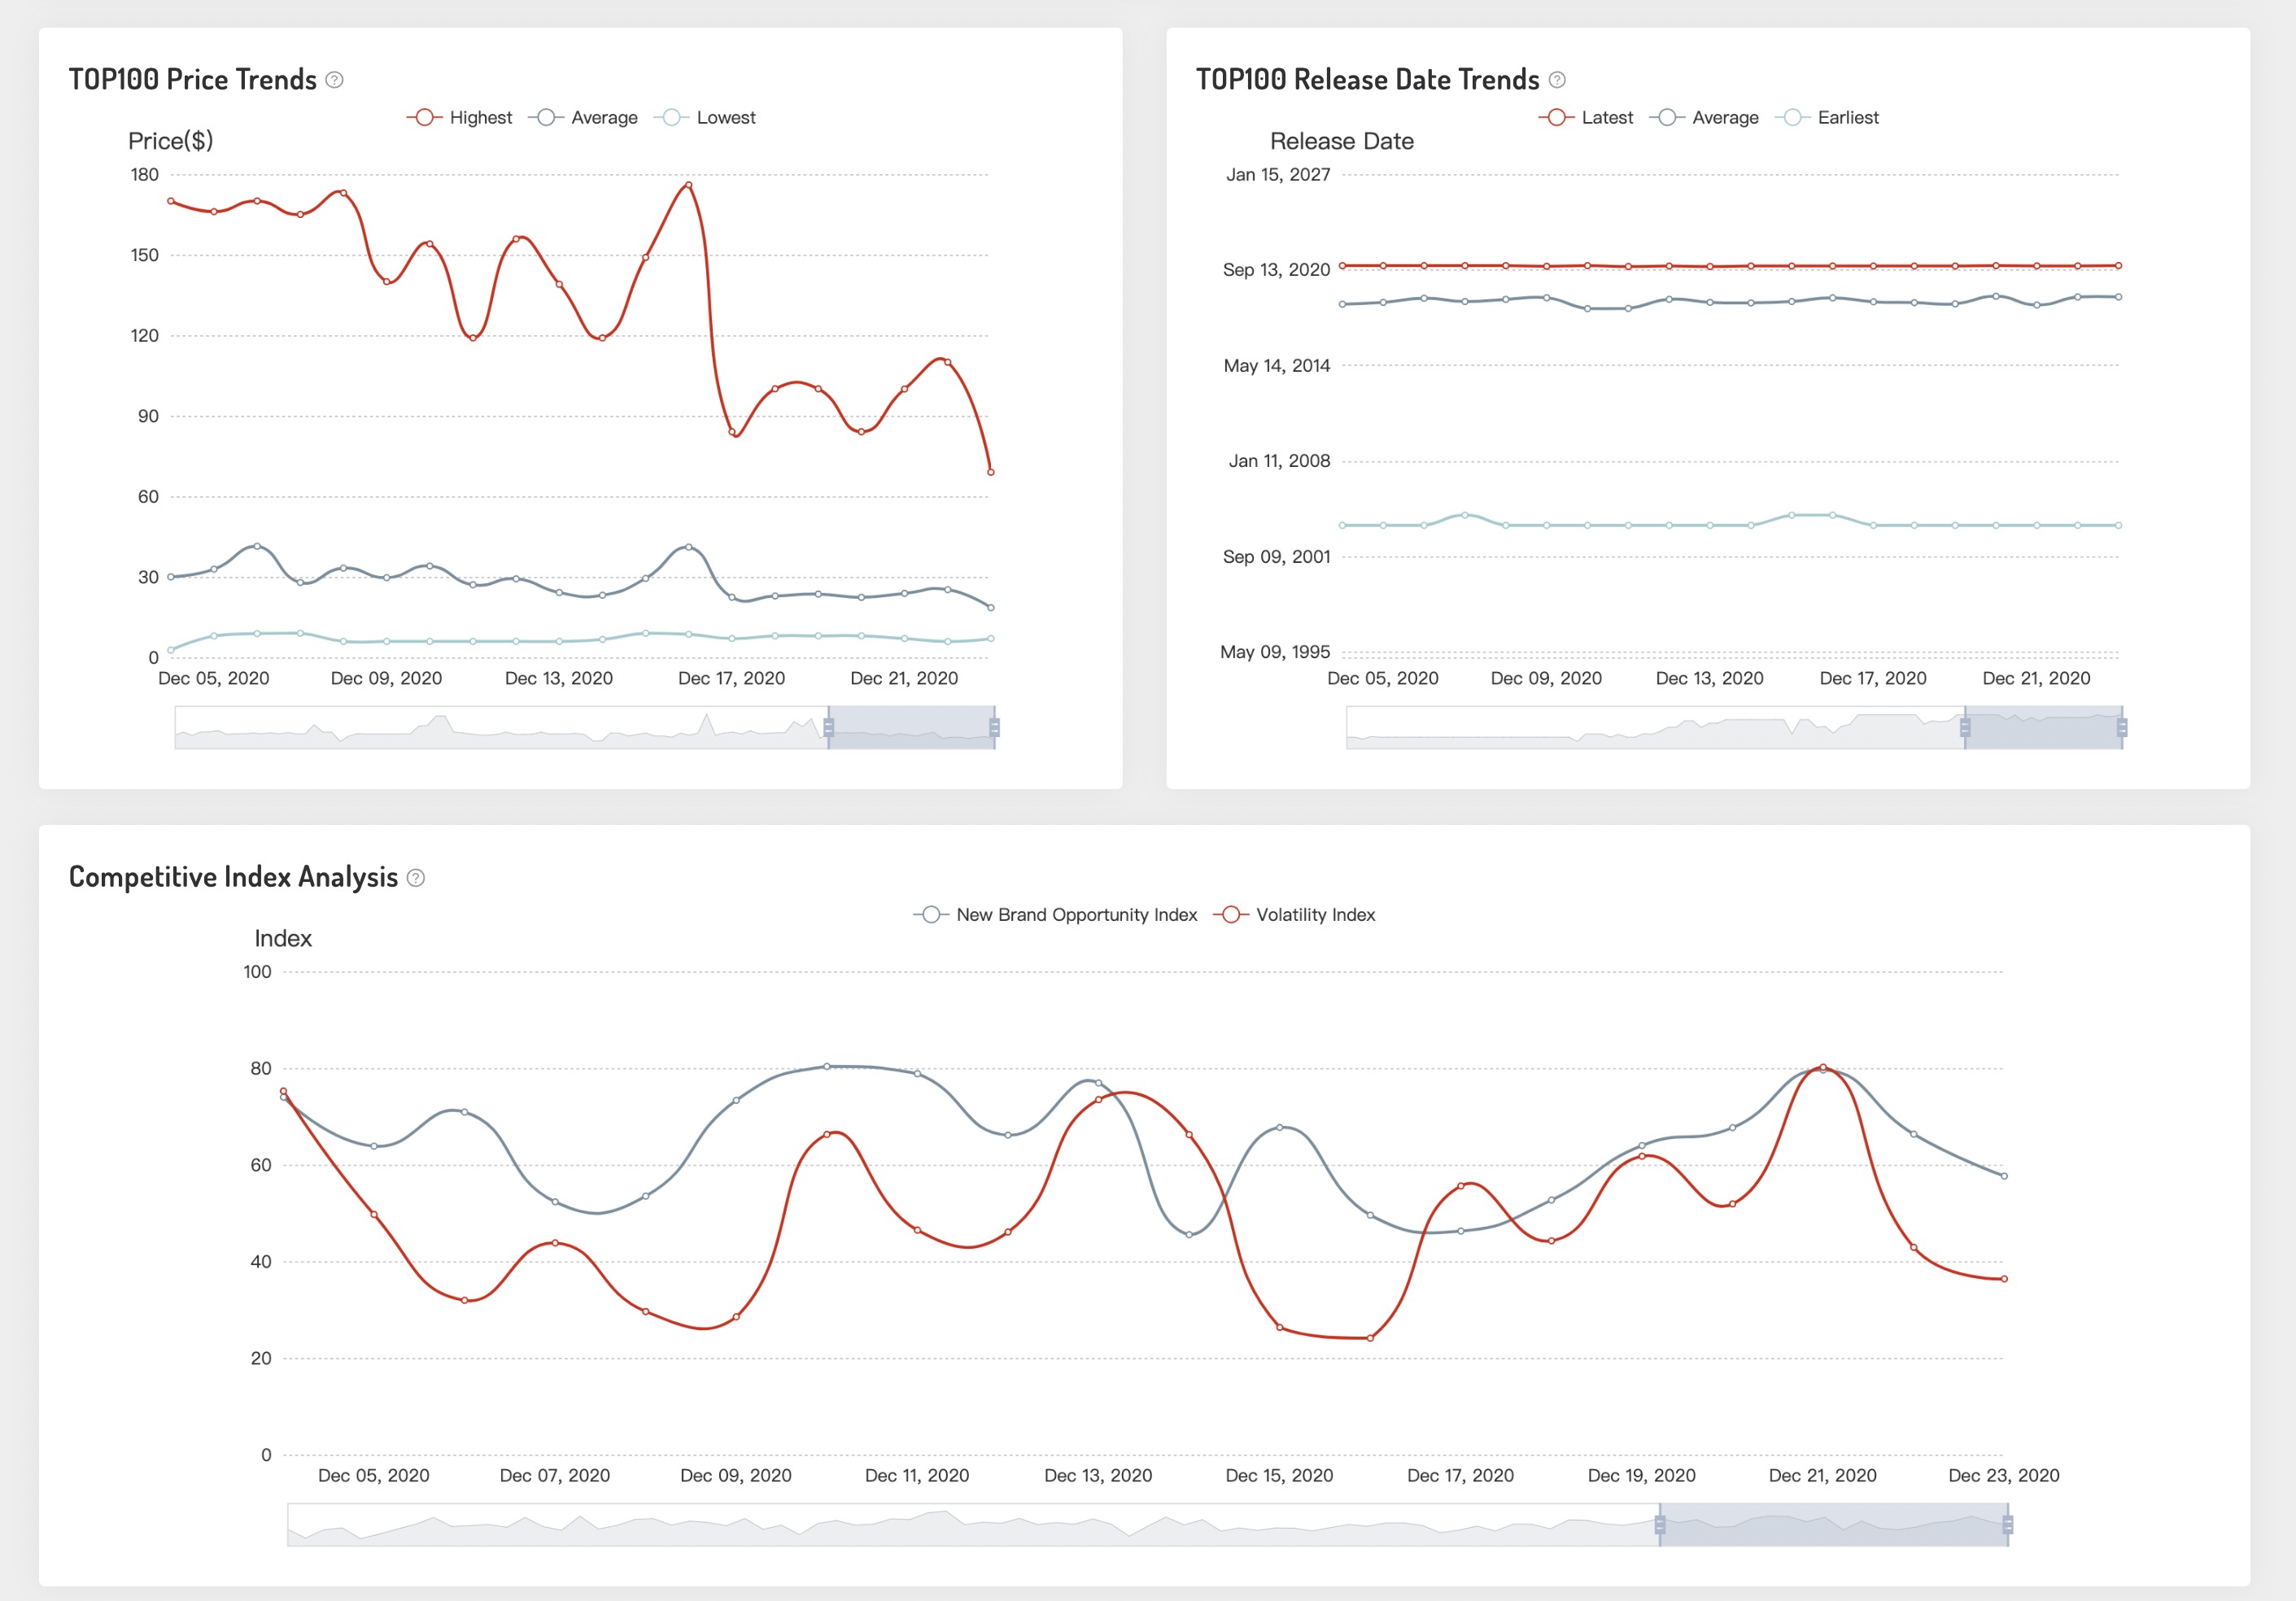
2.2.4.3 TOP100 Price & Release Date & Competitive Index
TOP100 Price Trends shows the price distribution of Top100 BSR, which could provide a basis when pricing your products.
TOP100 Release Date Trends demonstrates the general launching date of Top100 BSR new products in this category.
Competitive Index Analysis indicates the connection of the changes of volatility index and new brand opportunity index these two indicators. The volatility index of the category can be determined by the changes in the top brand in this category. The greater the volatility index, the more drastic the changes in the top products of this category, indicating the greater opportunities of entering this niche category. While we measure the opportunities of new brands by analyzing the changes in top brands. The greater the top brand changes, the greater the opportunities for other new brands in this category.
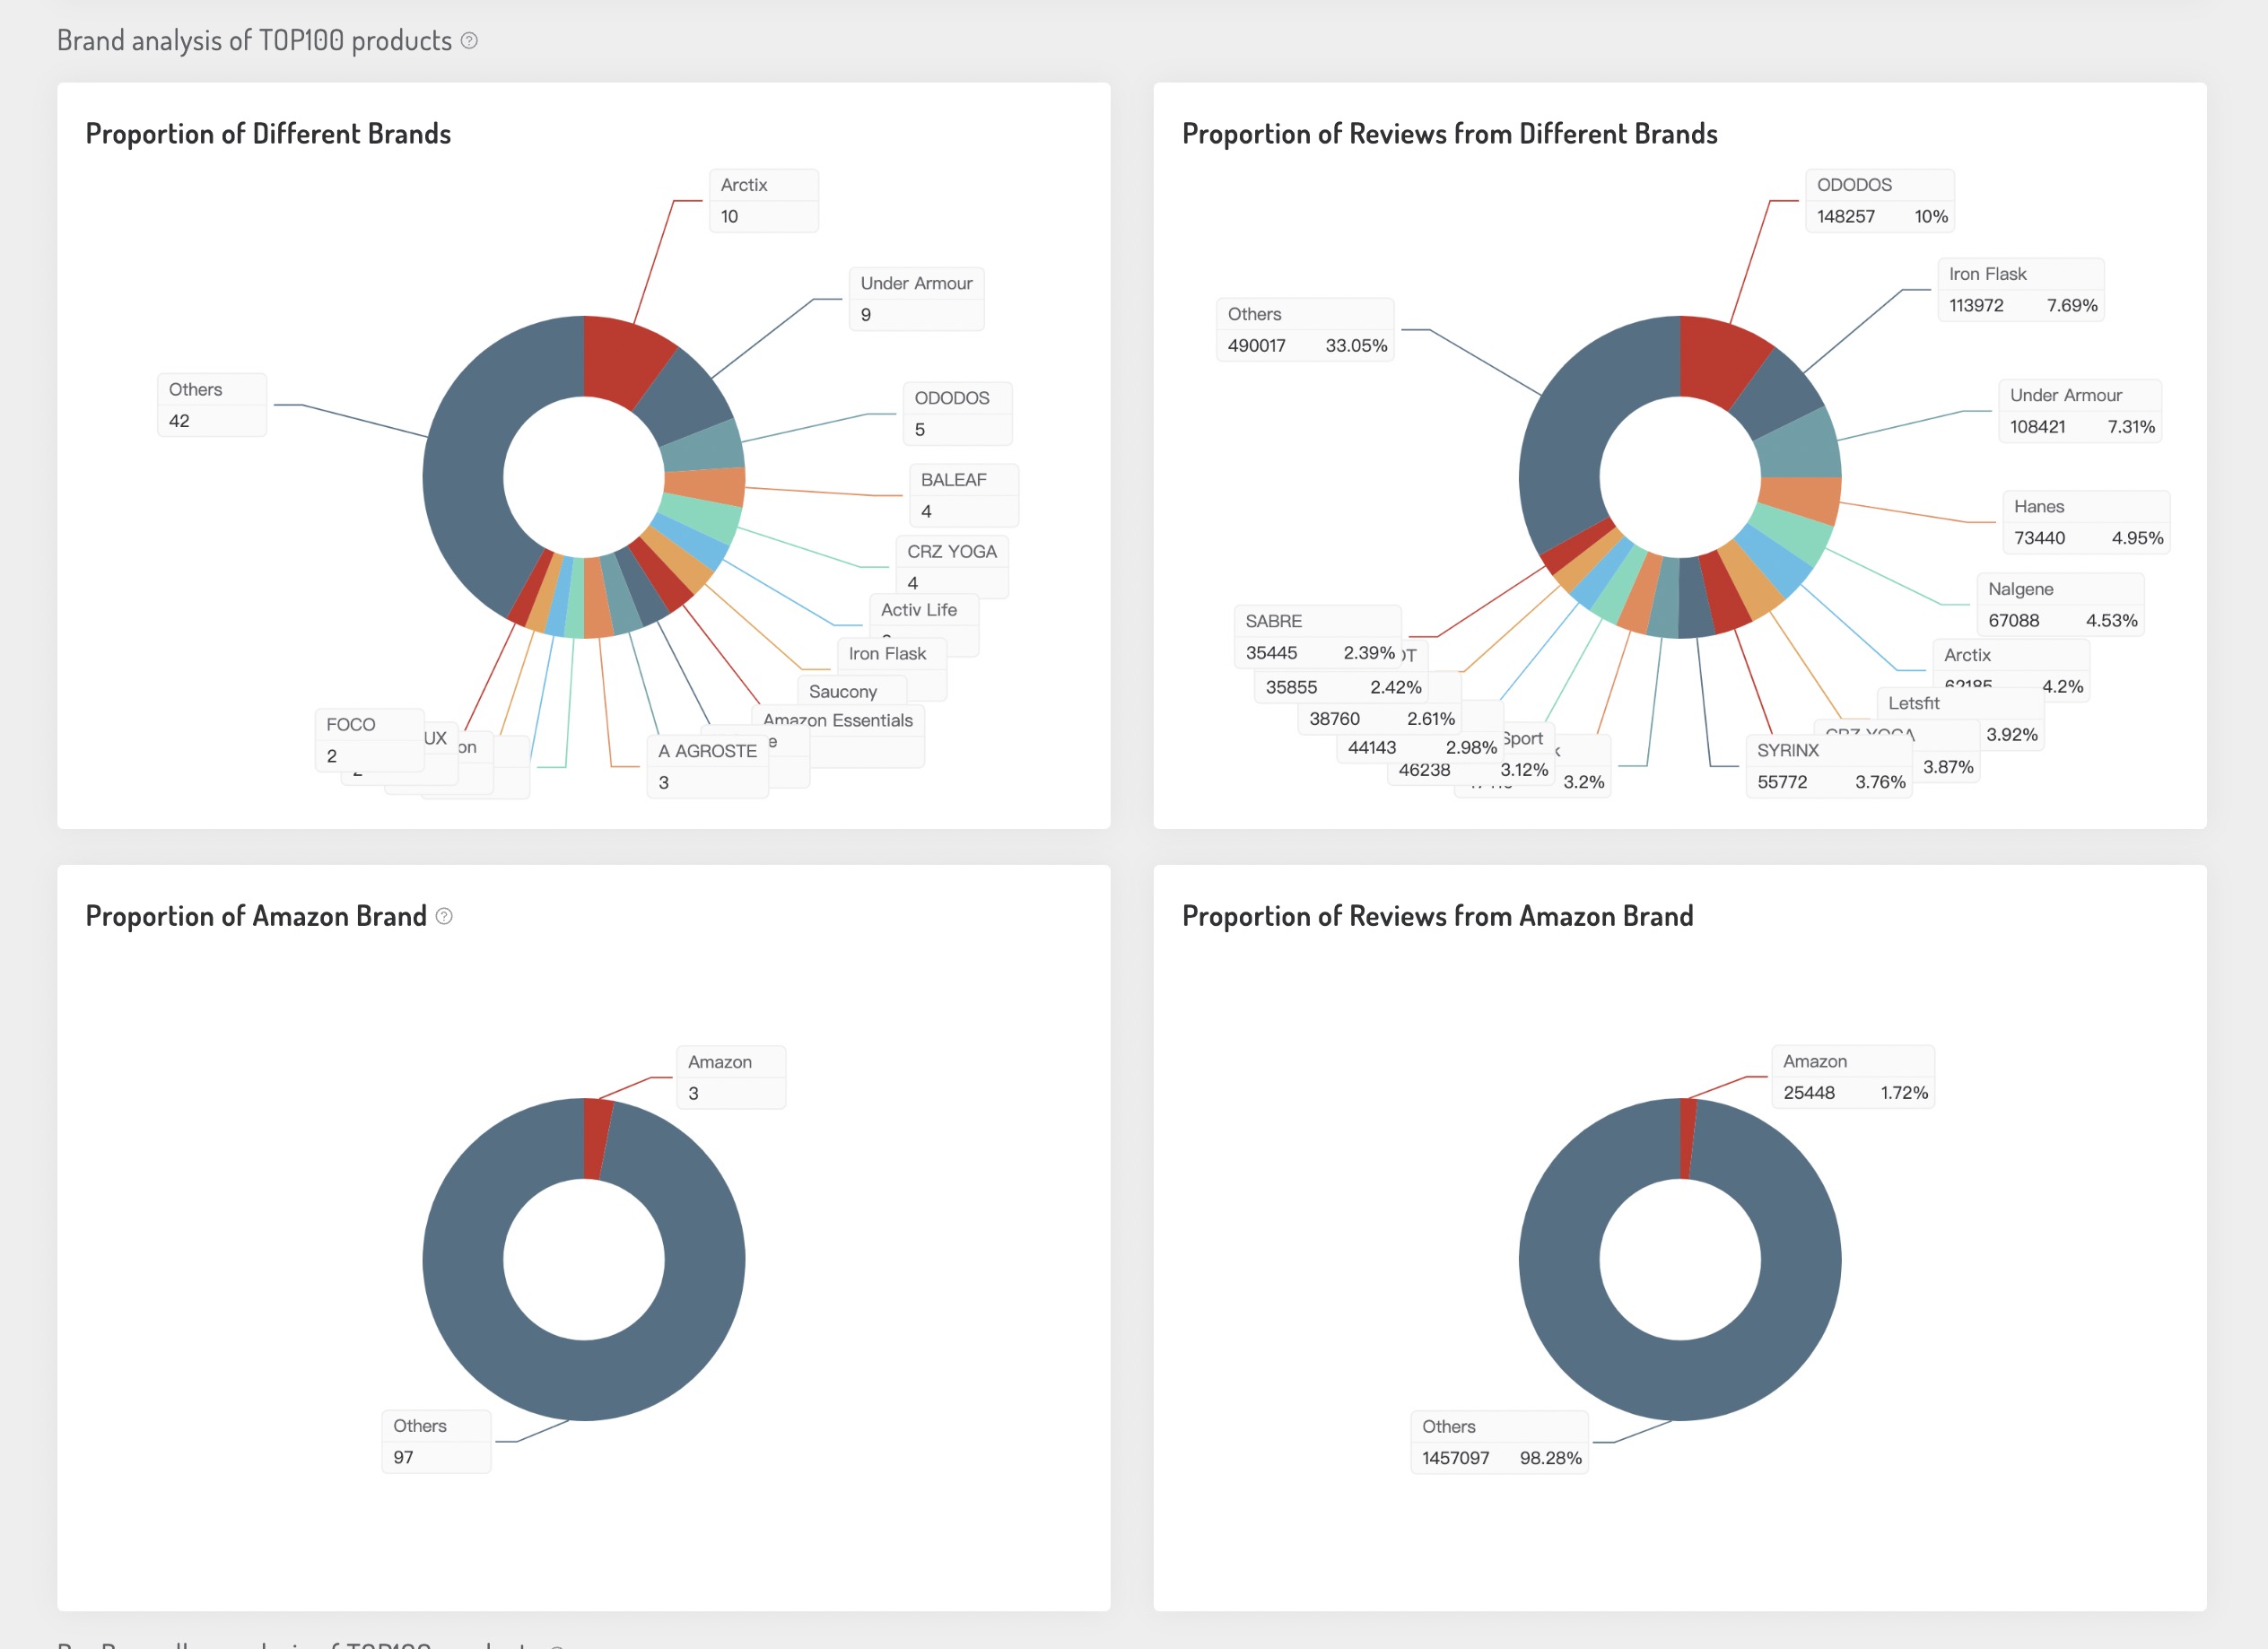
2.2.4.4 Brand Analysis of TOP100 Products
We analyze the competitiveness of top brands in this category from 4 dimensions: the proportion of top brands, the proportion of reviews from top brands, the proportion of top Amazon.com brands, and the proportion of reviews from top Amazon.com brands.
Top brands under this category are scattered and competing with each other, leaving us a good opportunity to enter. However, if there exist relatively concentrated monopoly brands in this category, it is likely there would be less opportunity.
Besides, if products sold by Amazon.com have dominated the category, third-party sellers are not suggested to settle in.
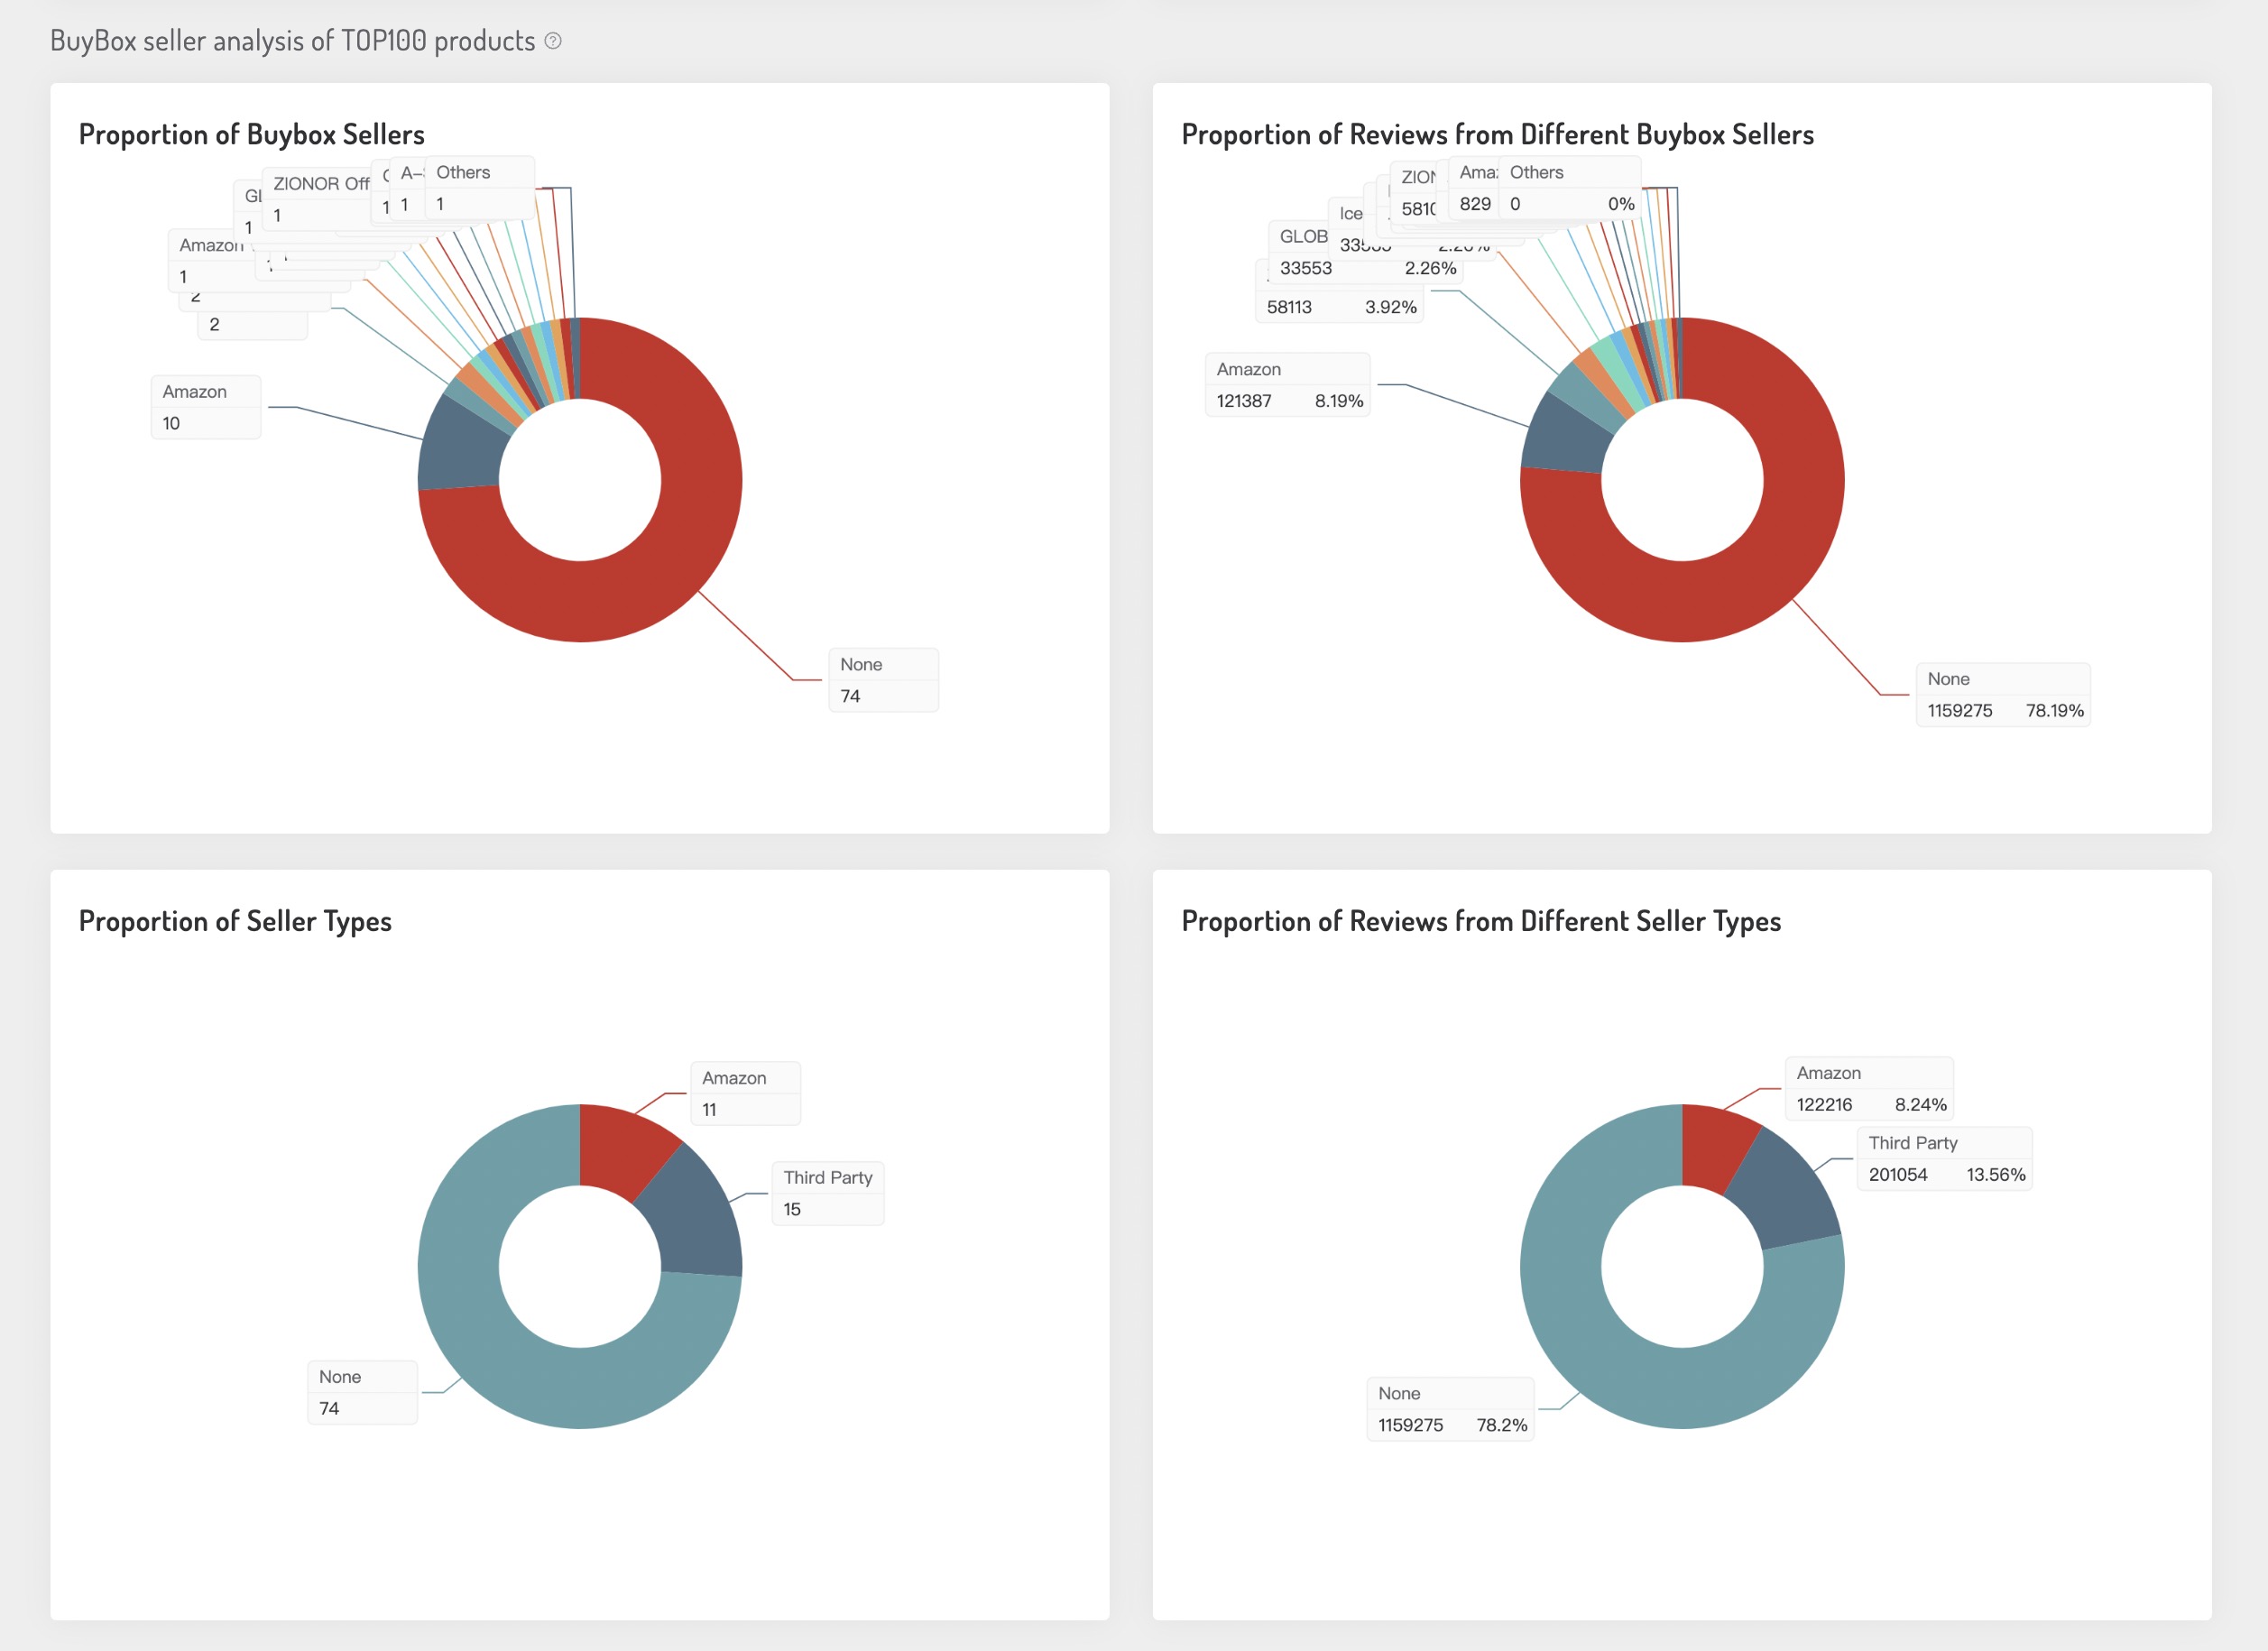
2.2.4.5 BuyBox Seller Analysis of TOP100 Products
We analyze the competitiveness of top Buybox sellers in this category from 4 dimensions: the proportion of top Buybox sellers, the proportion of reviews from top Buybox sellers, the proportion of top Buybox sellers types, the proportion of products’ reviews from different Buybox sellers types.
By analyzing the BuyBox sellers of a category, you can judge whether this market is dominated by a small number of sellers. If it’s not, you then still have a chance to launch your products in this category.
Additionally, the smaller the proportion of Amazon.com Buybox sellers, the more suitable for third-party sellers to enter.
3. Alerts & Tracking
3.1 Hijacker Alerts
3.1.1 Usage Scenario
Hijacker Alerts is used to spy on whether your products are hijacked by other Amazon sellers. You will get an instant email notification once your listing is hijacked, or other actionable events occur, which allows you to protect your products in real-time.
It’s also applicable to sellers who are hijacking others’ listings, they can know the product’s status in real-time.
3.1.2 Data Sources
The product’s hijacker data presented on the website are powered by our powerful database, it updates in real-time, you will get instant notification of whatever actionable events occur.
3.1.3 Introduction to Functions
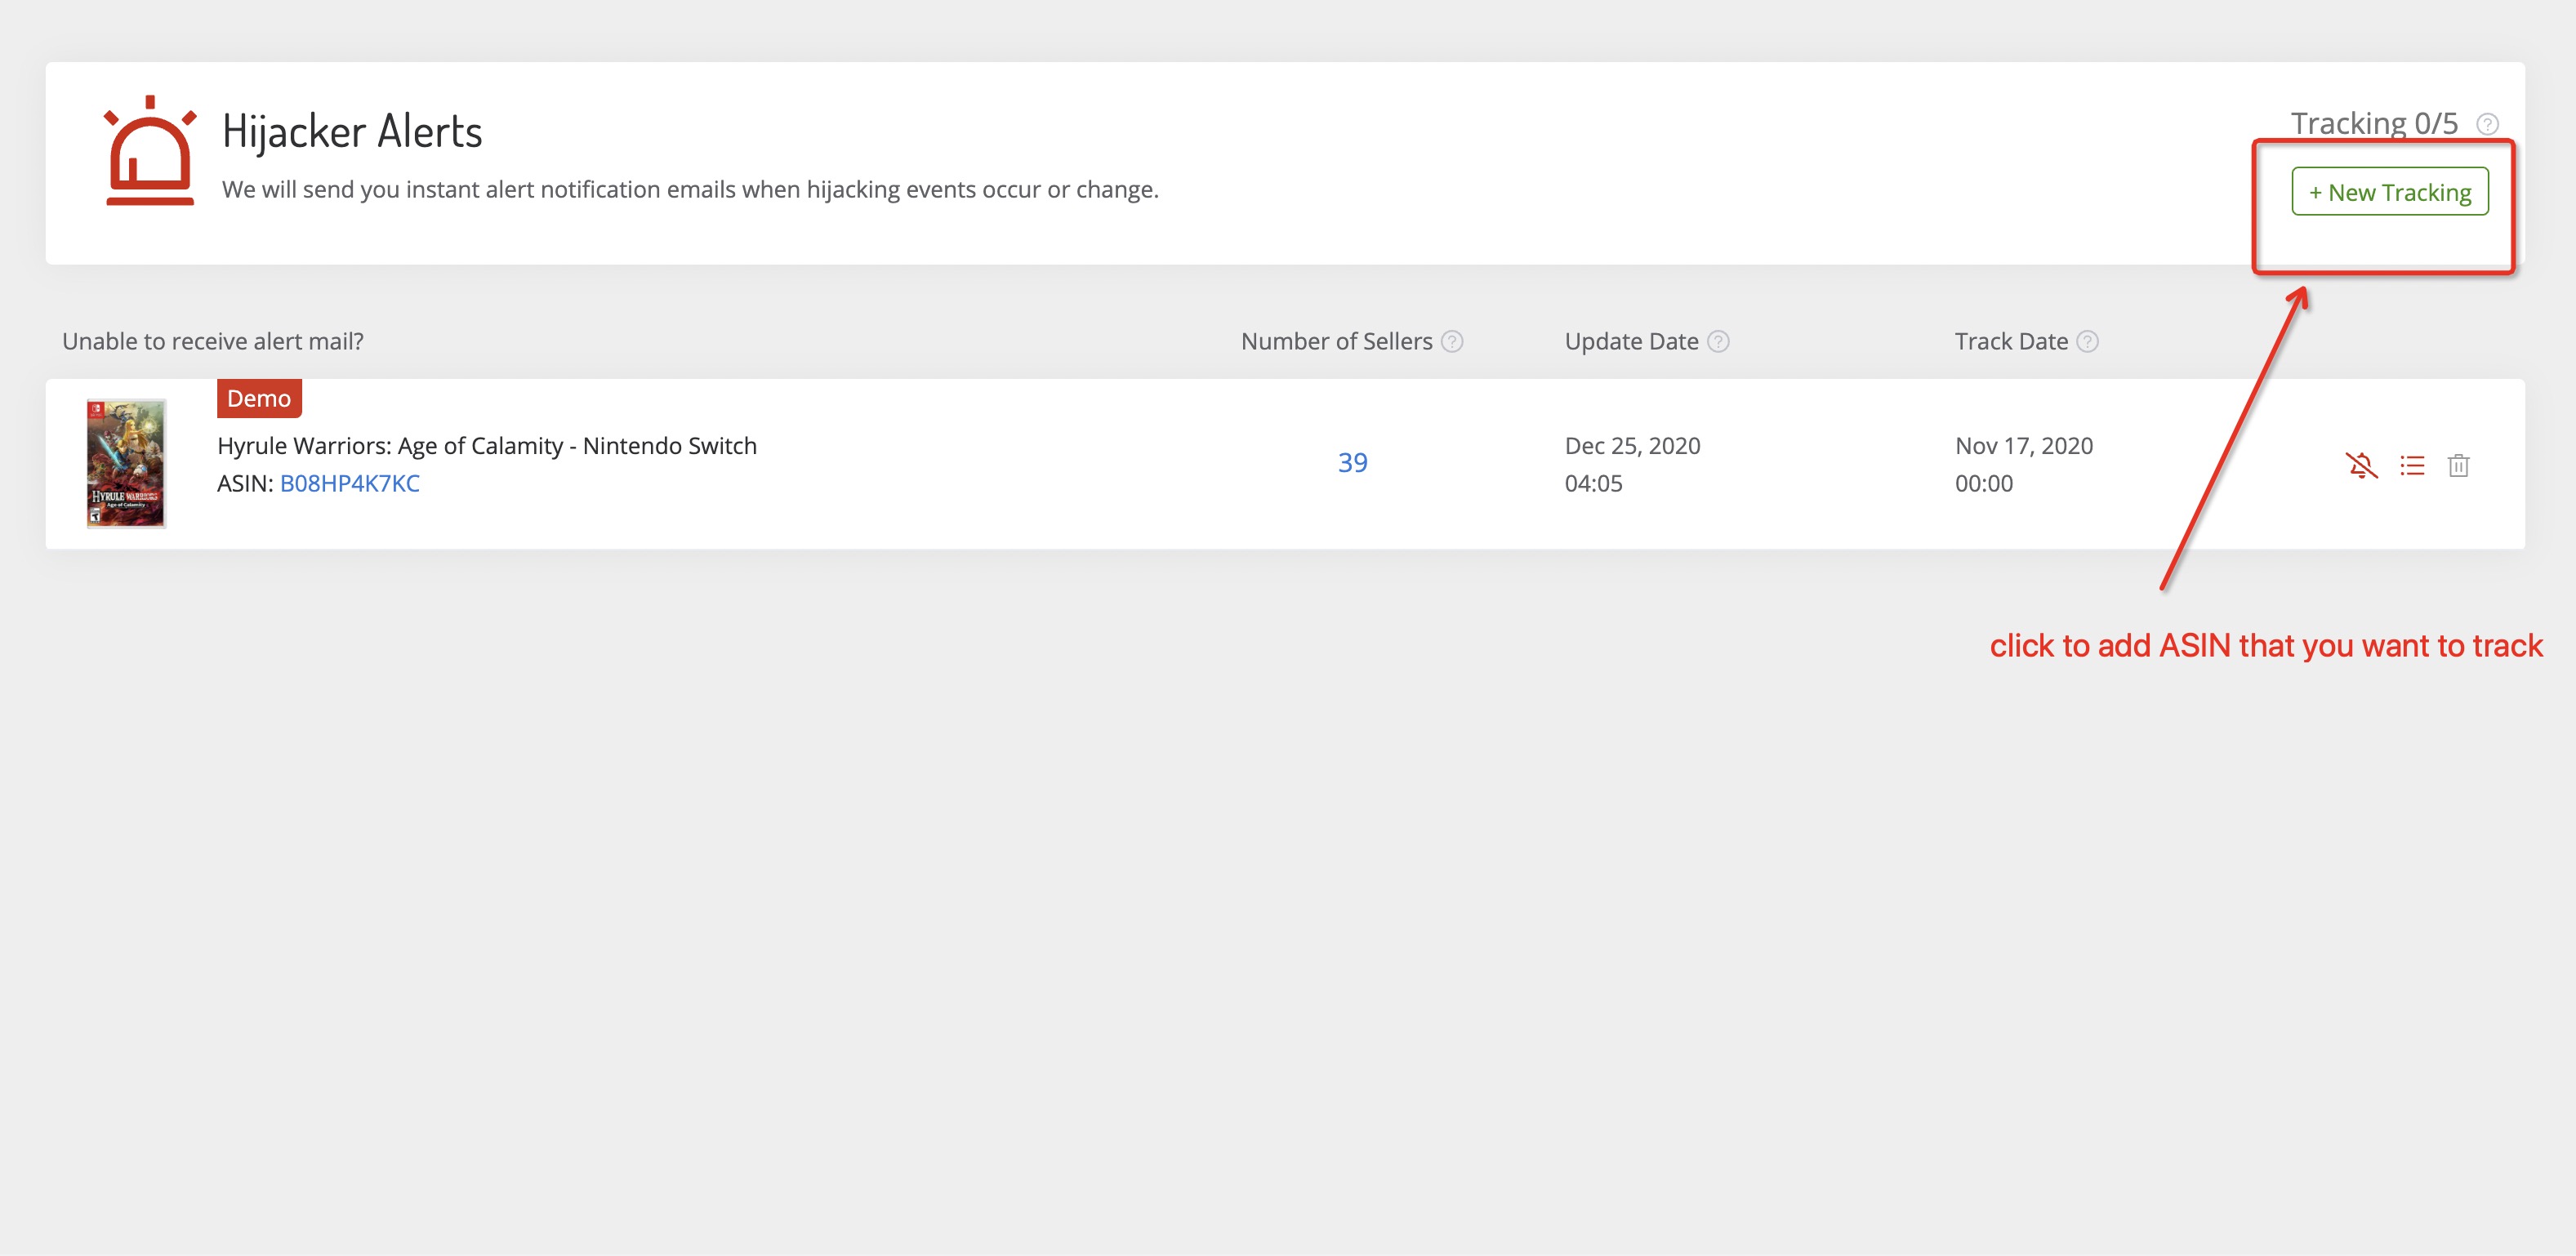
3.1.3.1 On the default page of Hijacker Alerts, you can click these two green buttons to start tracking.
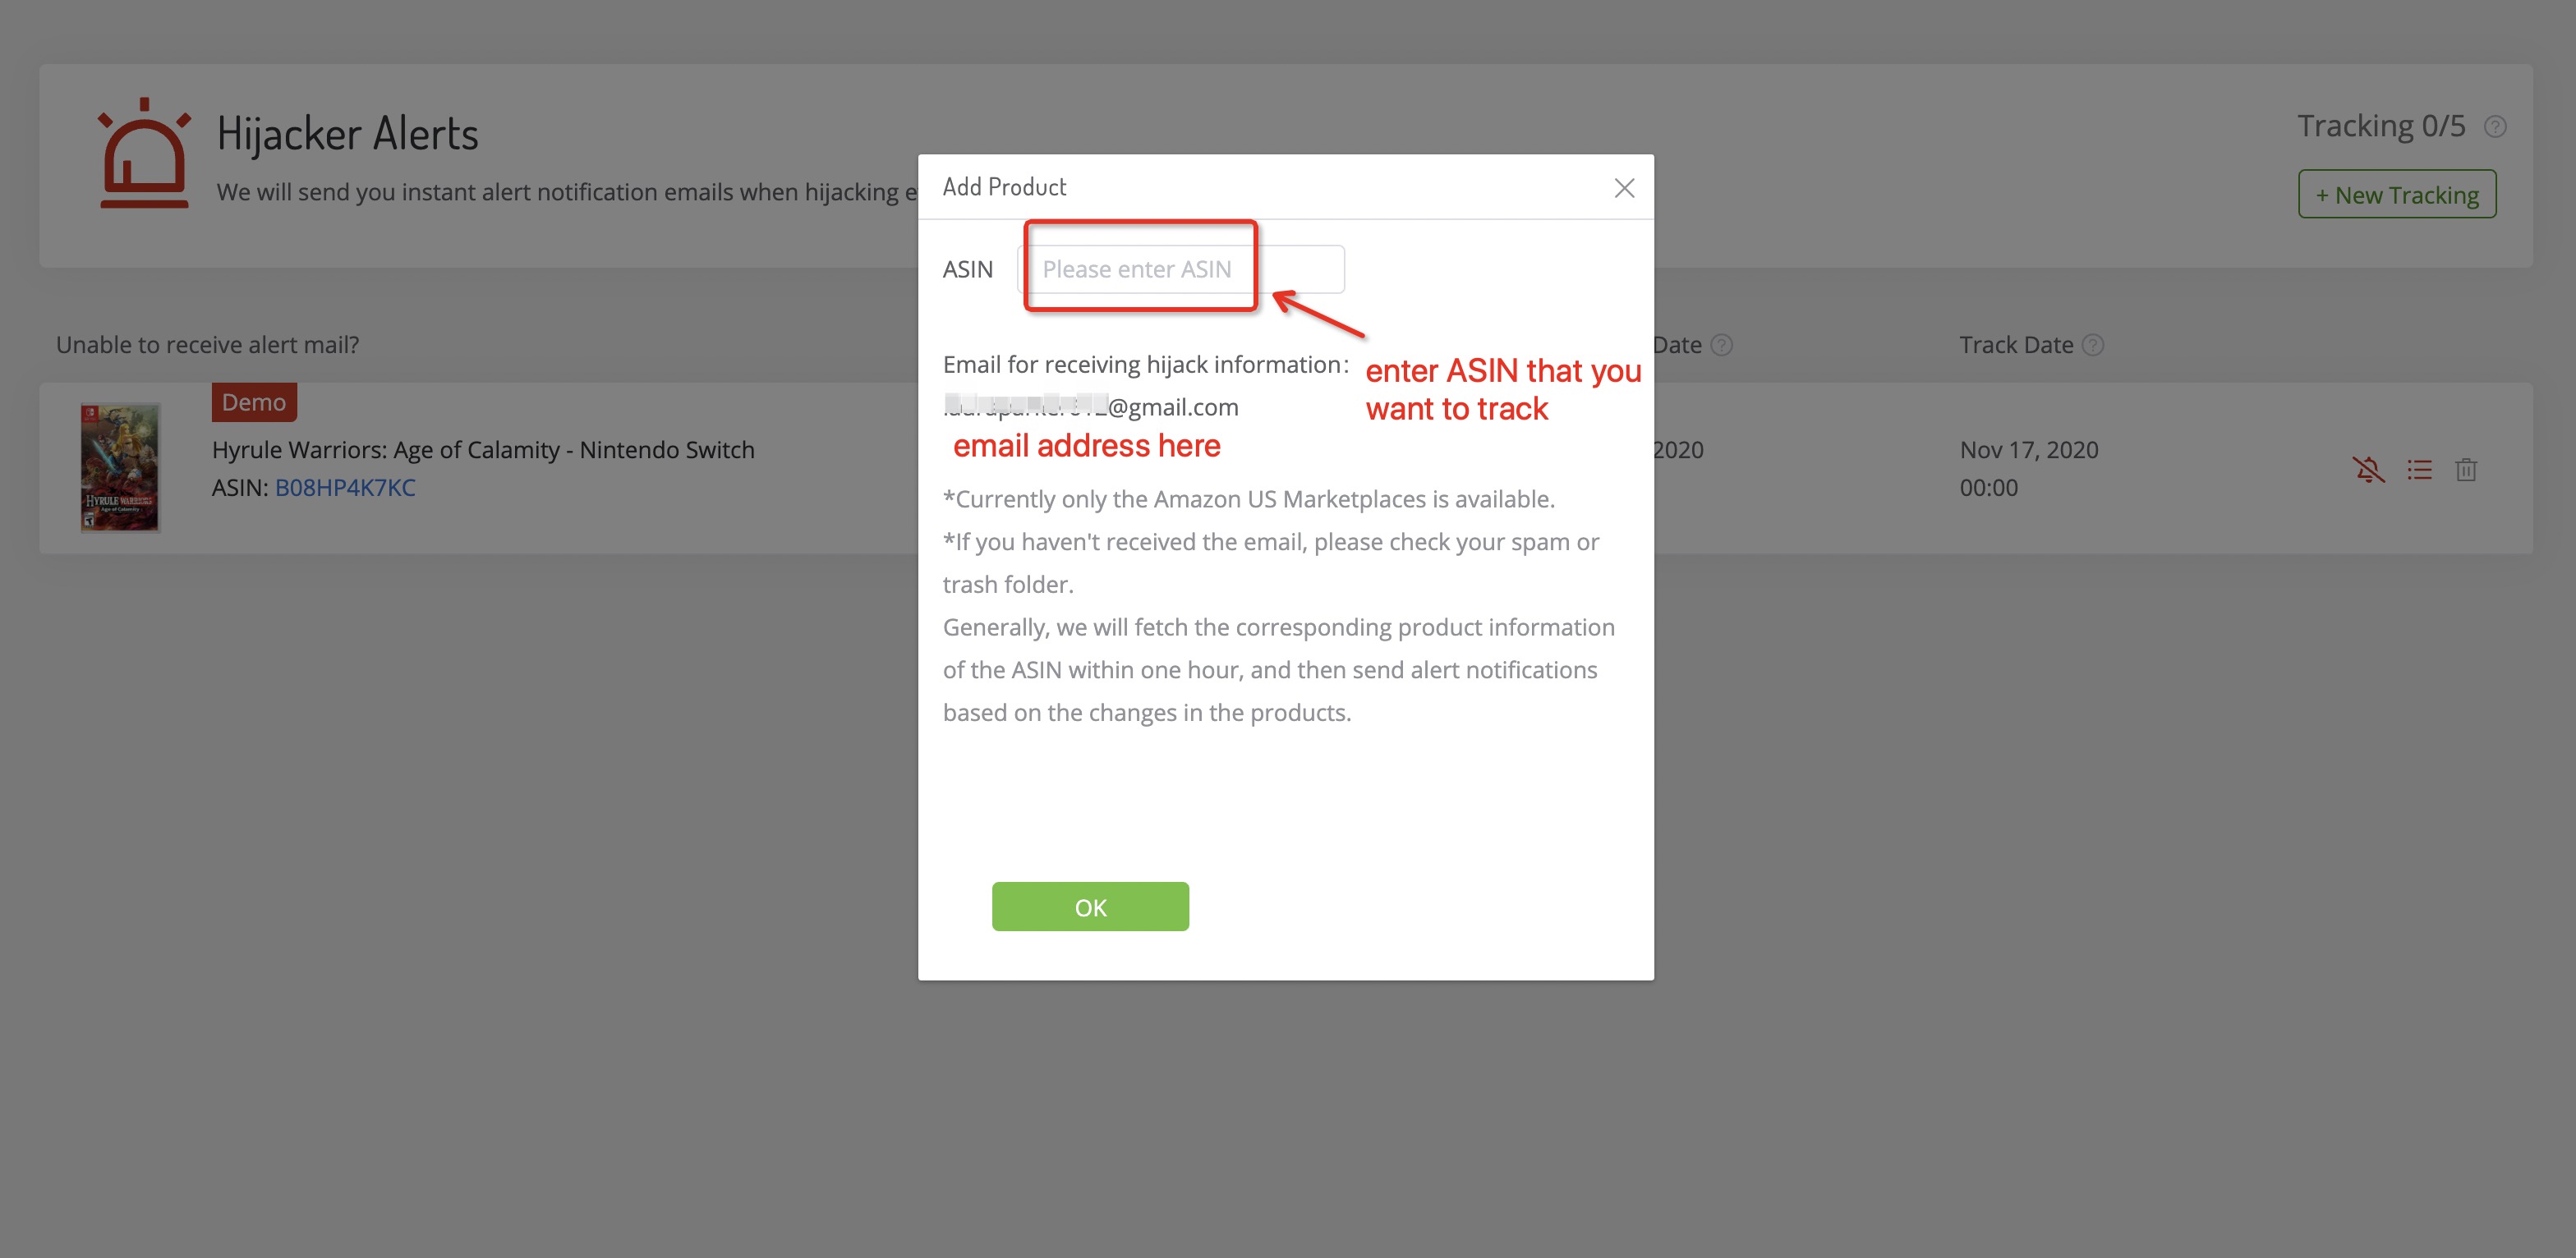
3.1.3.2 Input the product ASIN that you want to track in the pop-up window, click the “OK” button to put this ASIN into your tracking list.
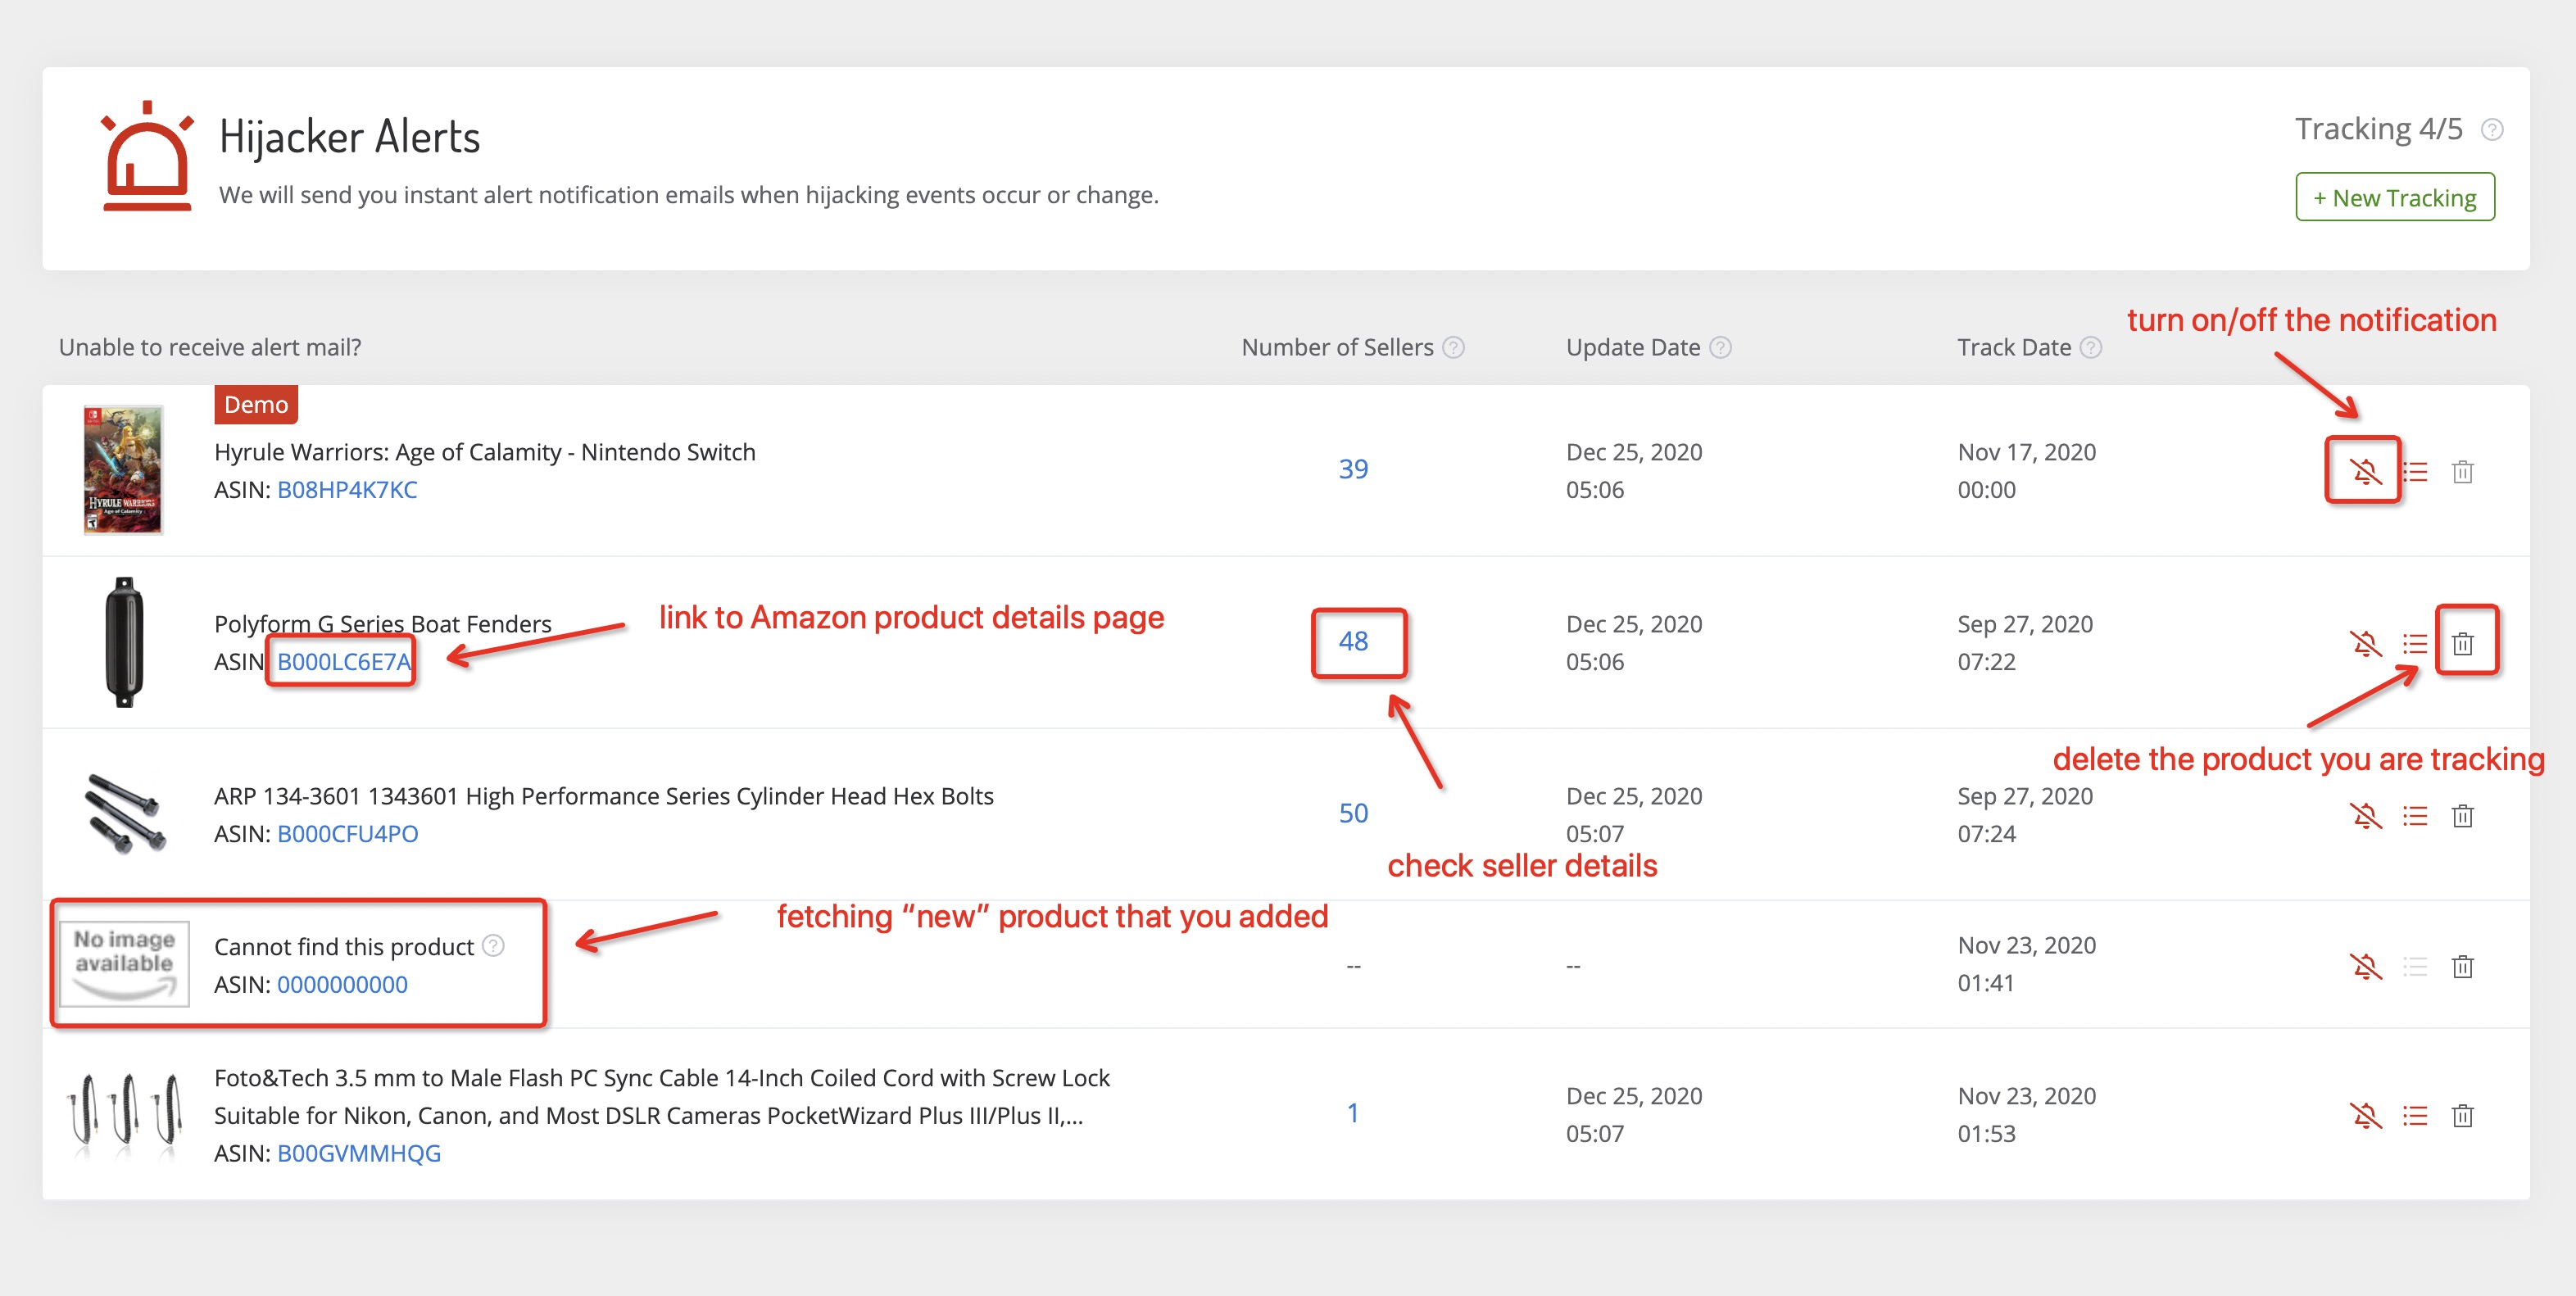
3.1.3.3 It shows a list of products that you are tracking, click the ASIN number and it will link to Amazon product’s details page, click “number of sellers” to see hijacker details. Besides, you can turn on or off the hijackers’ notification, and you can also delete the products that you are tracking.
Some products do not exist in our database currently. If you input the “new” ASIN, and then we’re going to fetch the data.
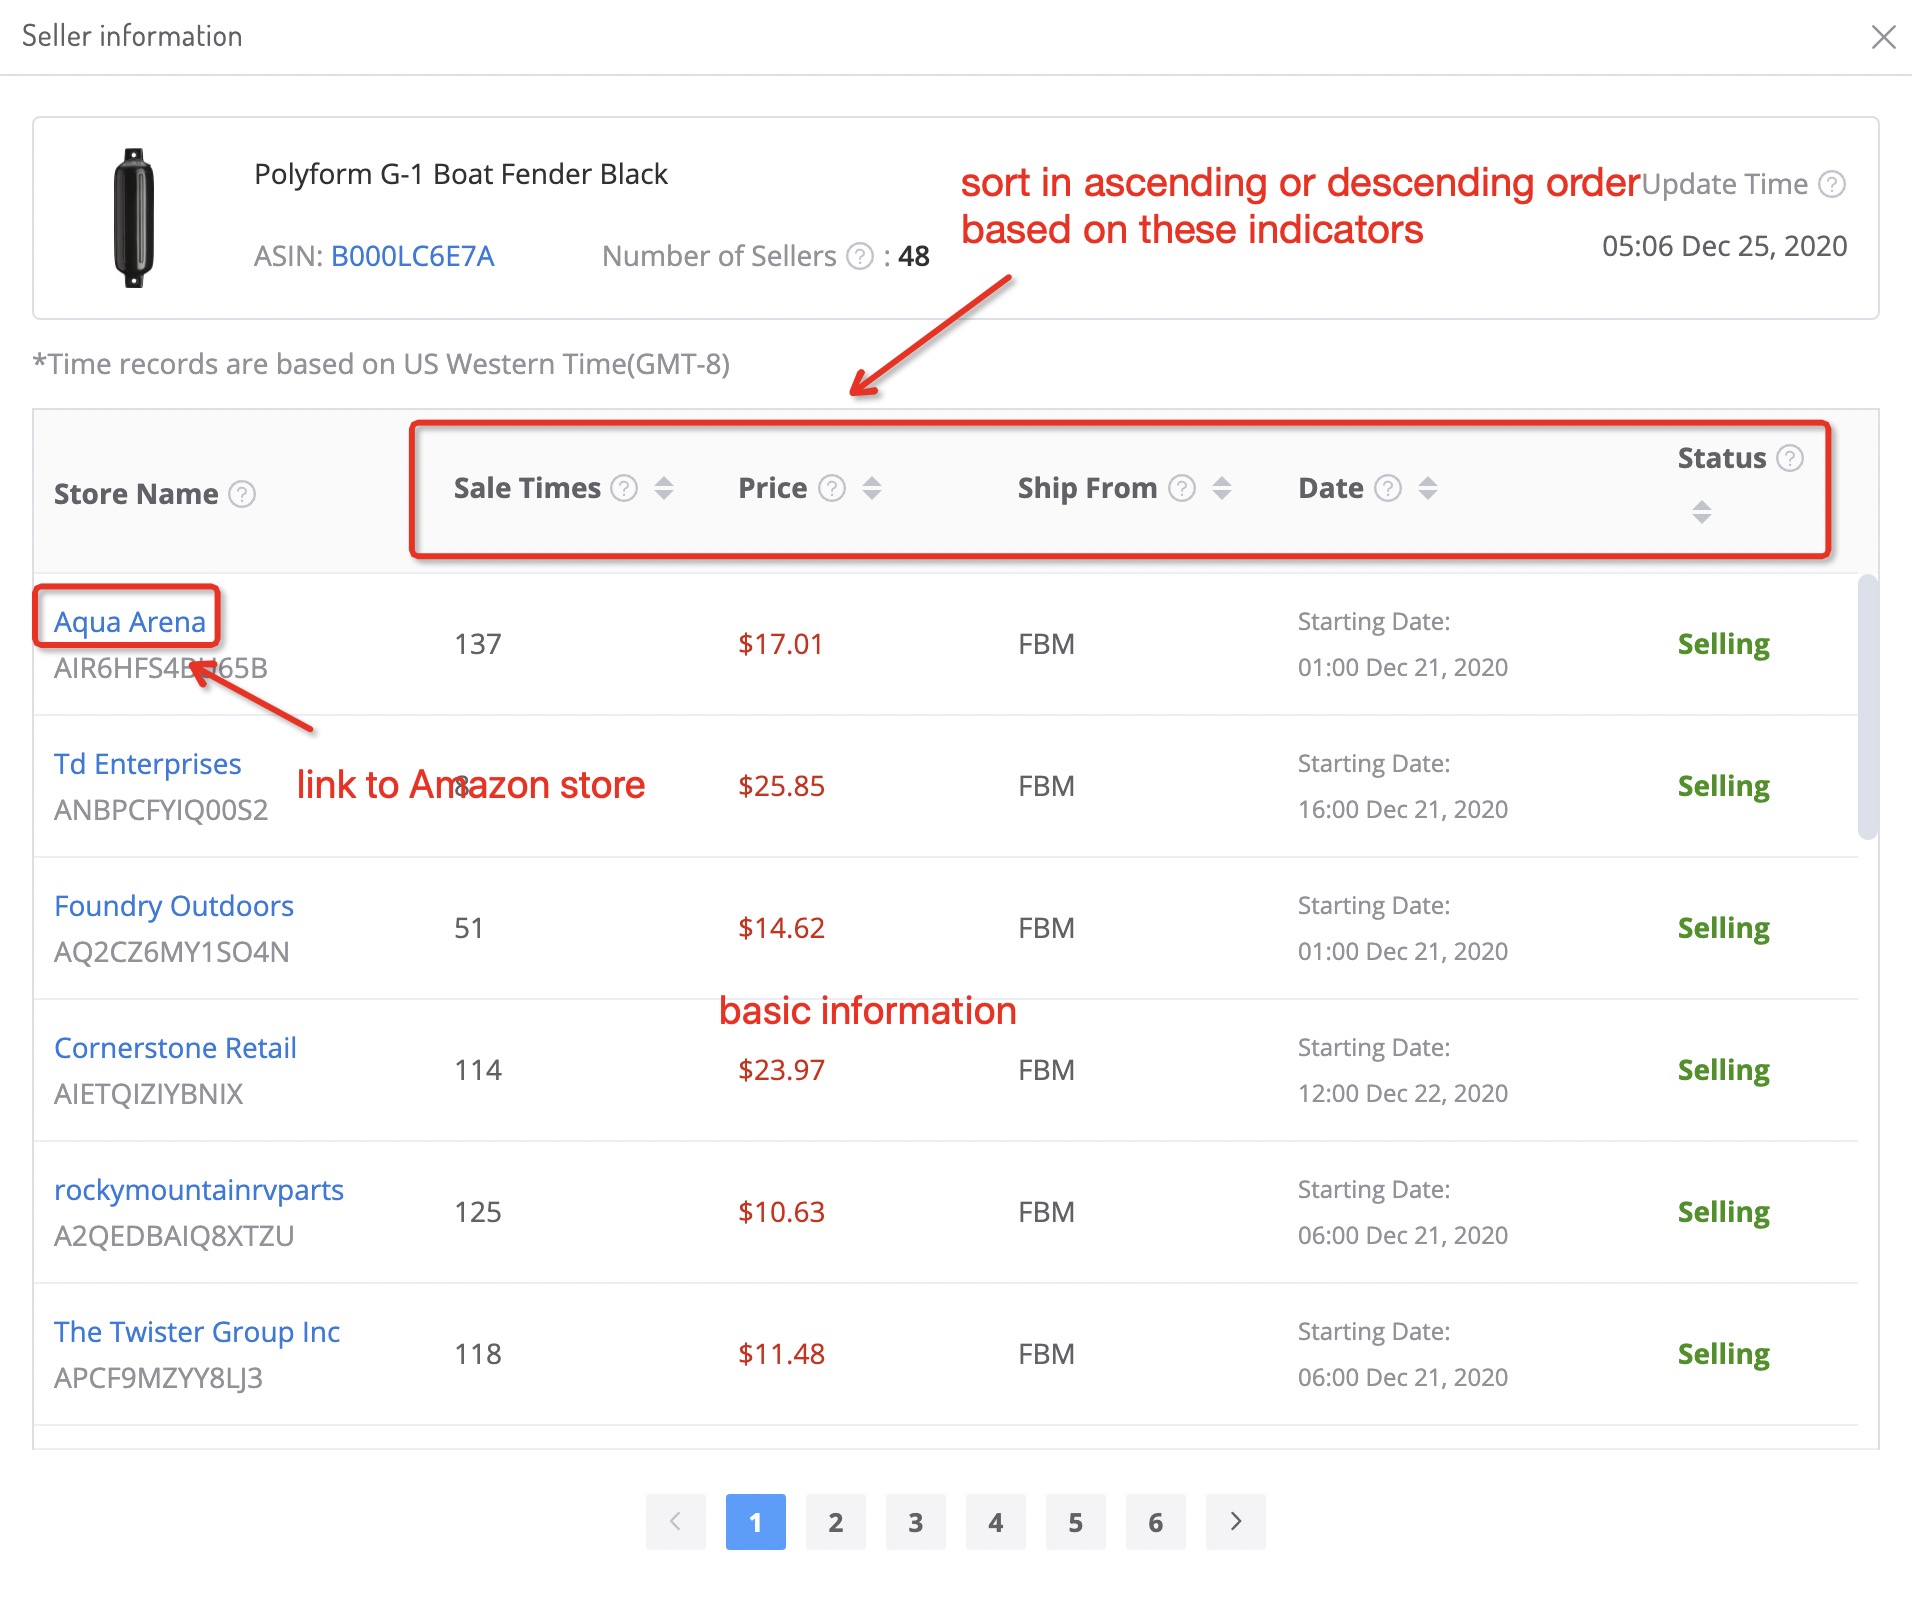
3.1.3.4 Hijacker Details shows the details of all hijackers regarding this product since tracking, and can be sorted in ascending or descending order based on sales times, price, shipping methods, hijacking date, and status(selling or remove).
And when clicking the store’s name, it will link to that Amazon store.
3.2 Product Tracking
3.2.1 Usage Scenario
Product Tracking contains these indicators: number of sellers, sales, BSR, and the number of positive/negative reviews. You can track your competitors’ new strategies, take steps, and make smarter decisions.
3.2.2 Data Sources
The product data presented on the website are powered by our powerful database, it updates in real-time. Whenever any changes happen on your tracking products, you will be notified.
3.2.3 Introduction to Functions
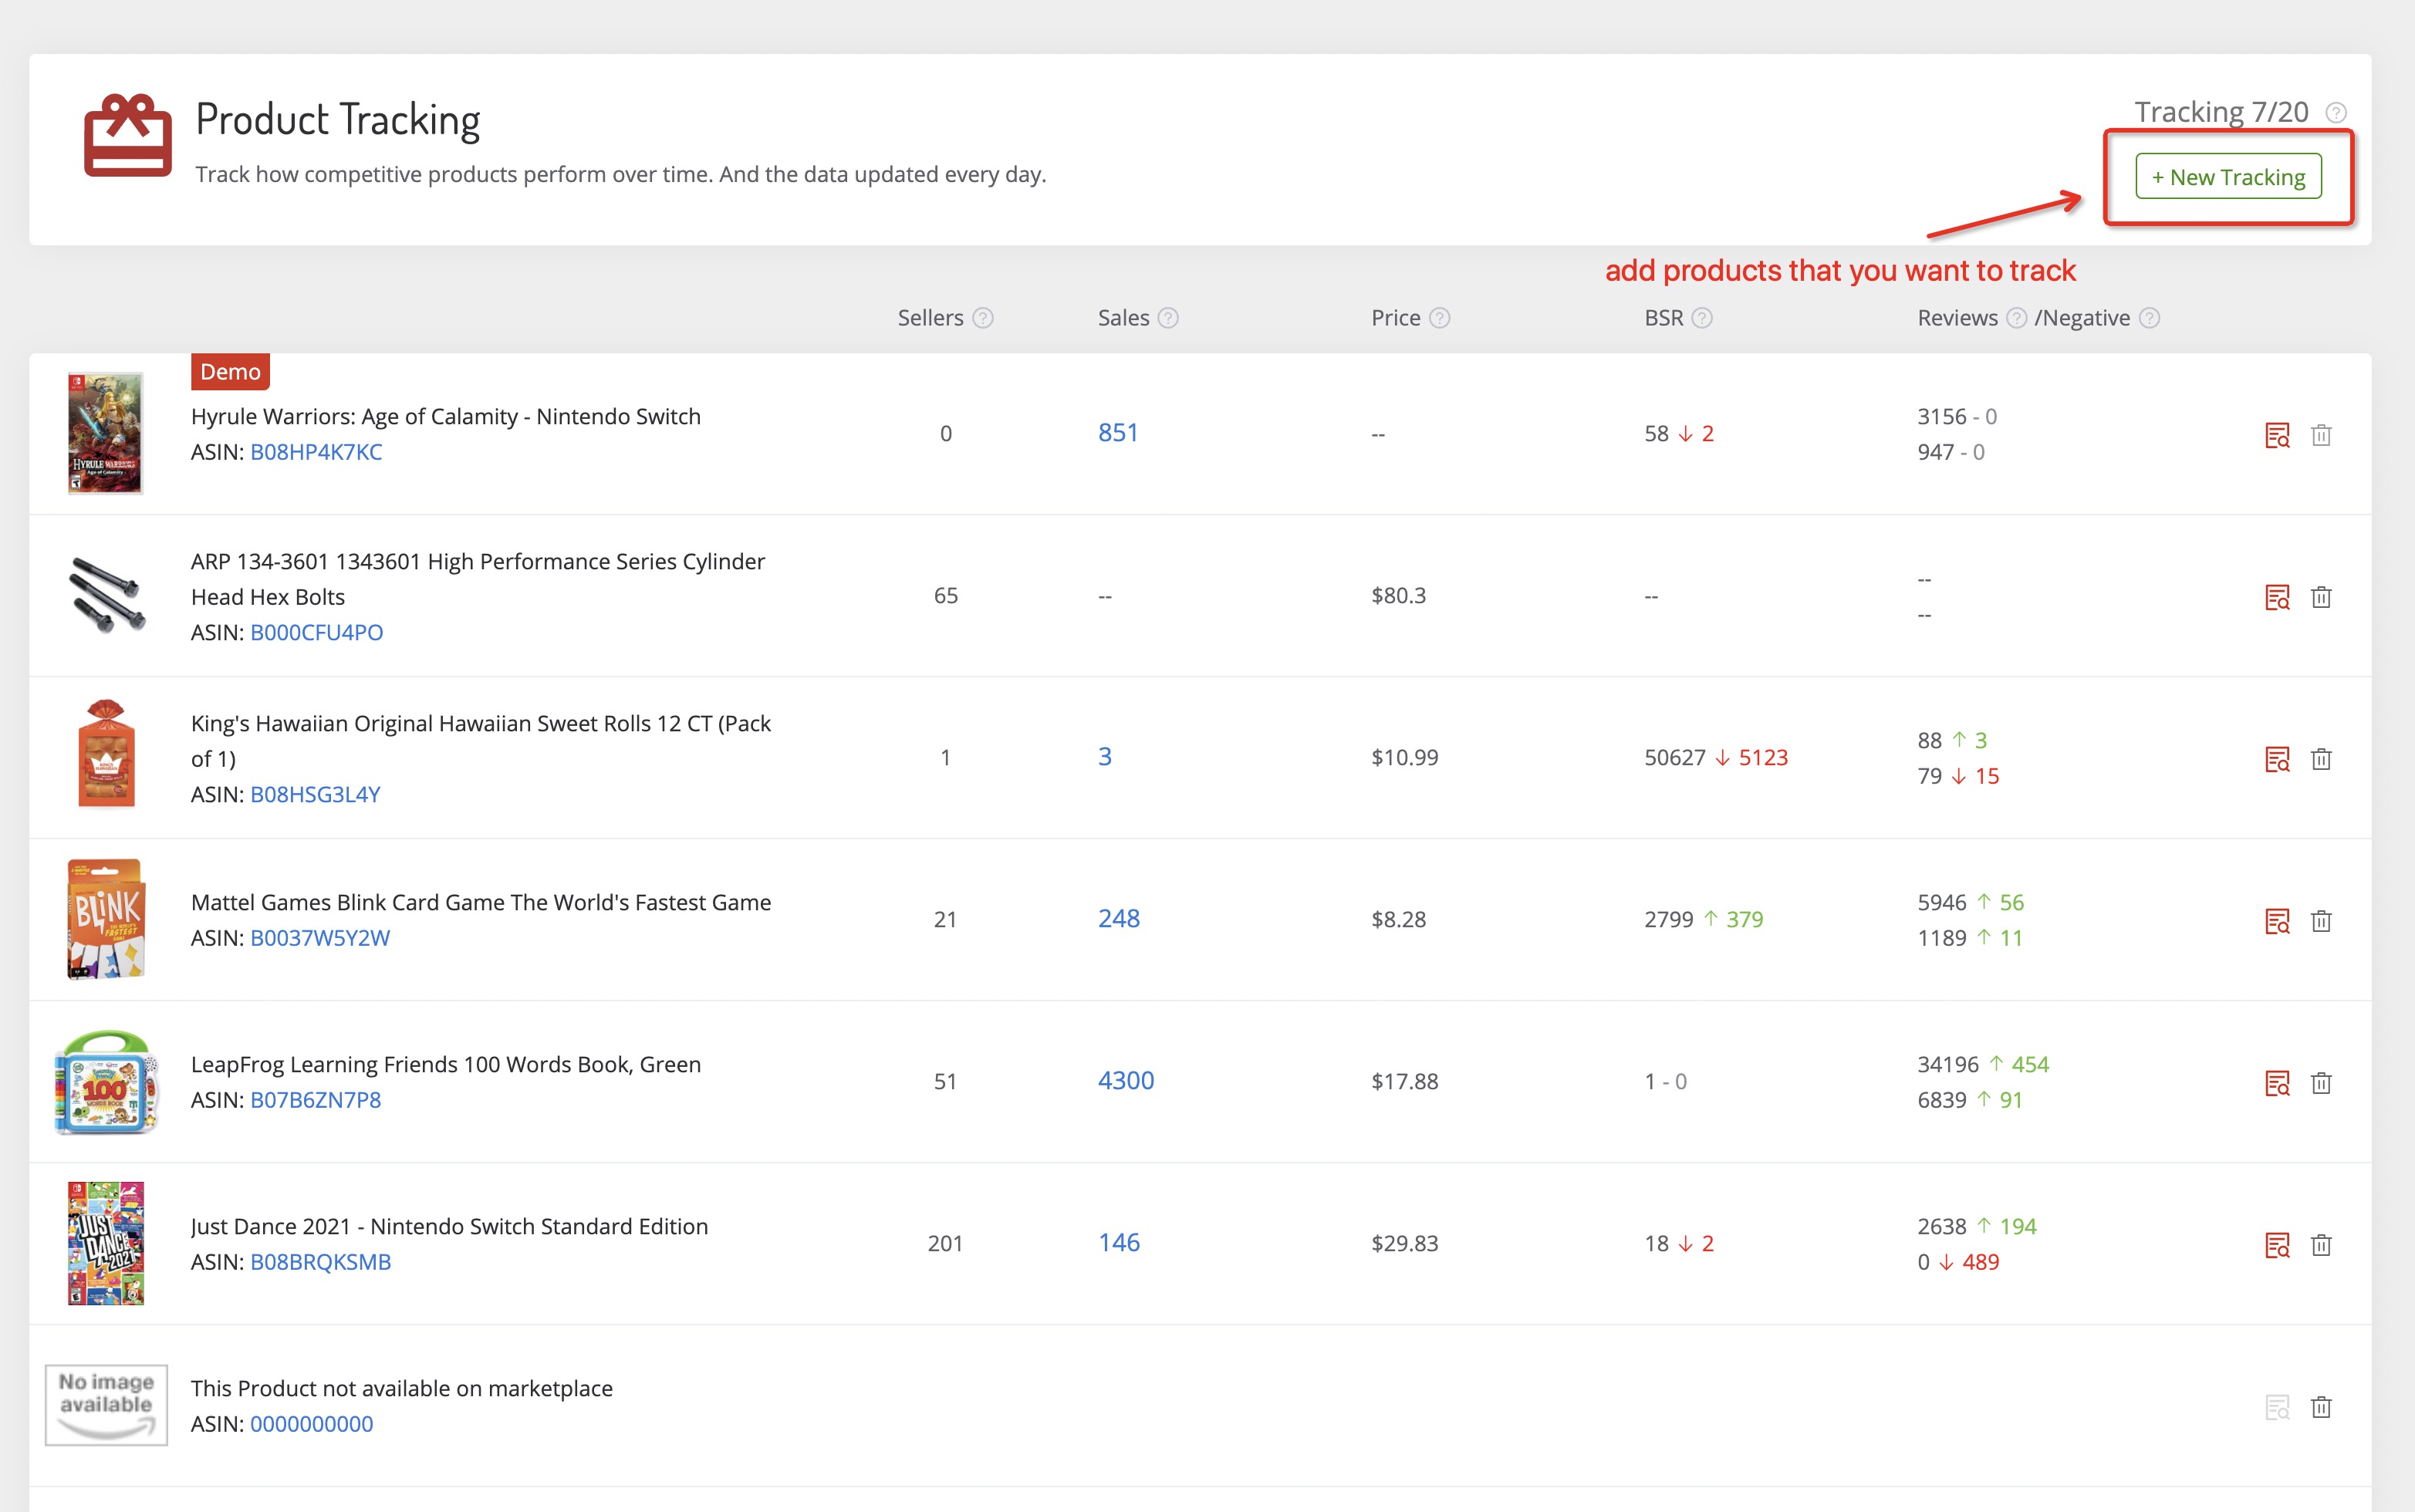
3.2.3.1 On the default page of Product Tracking, you can click these two green buttons to start tracking.
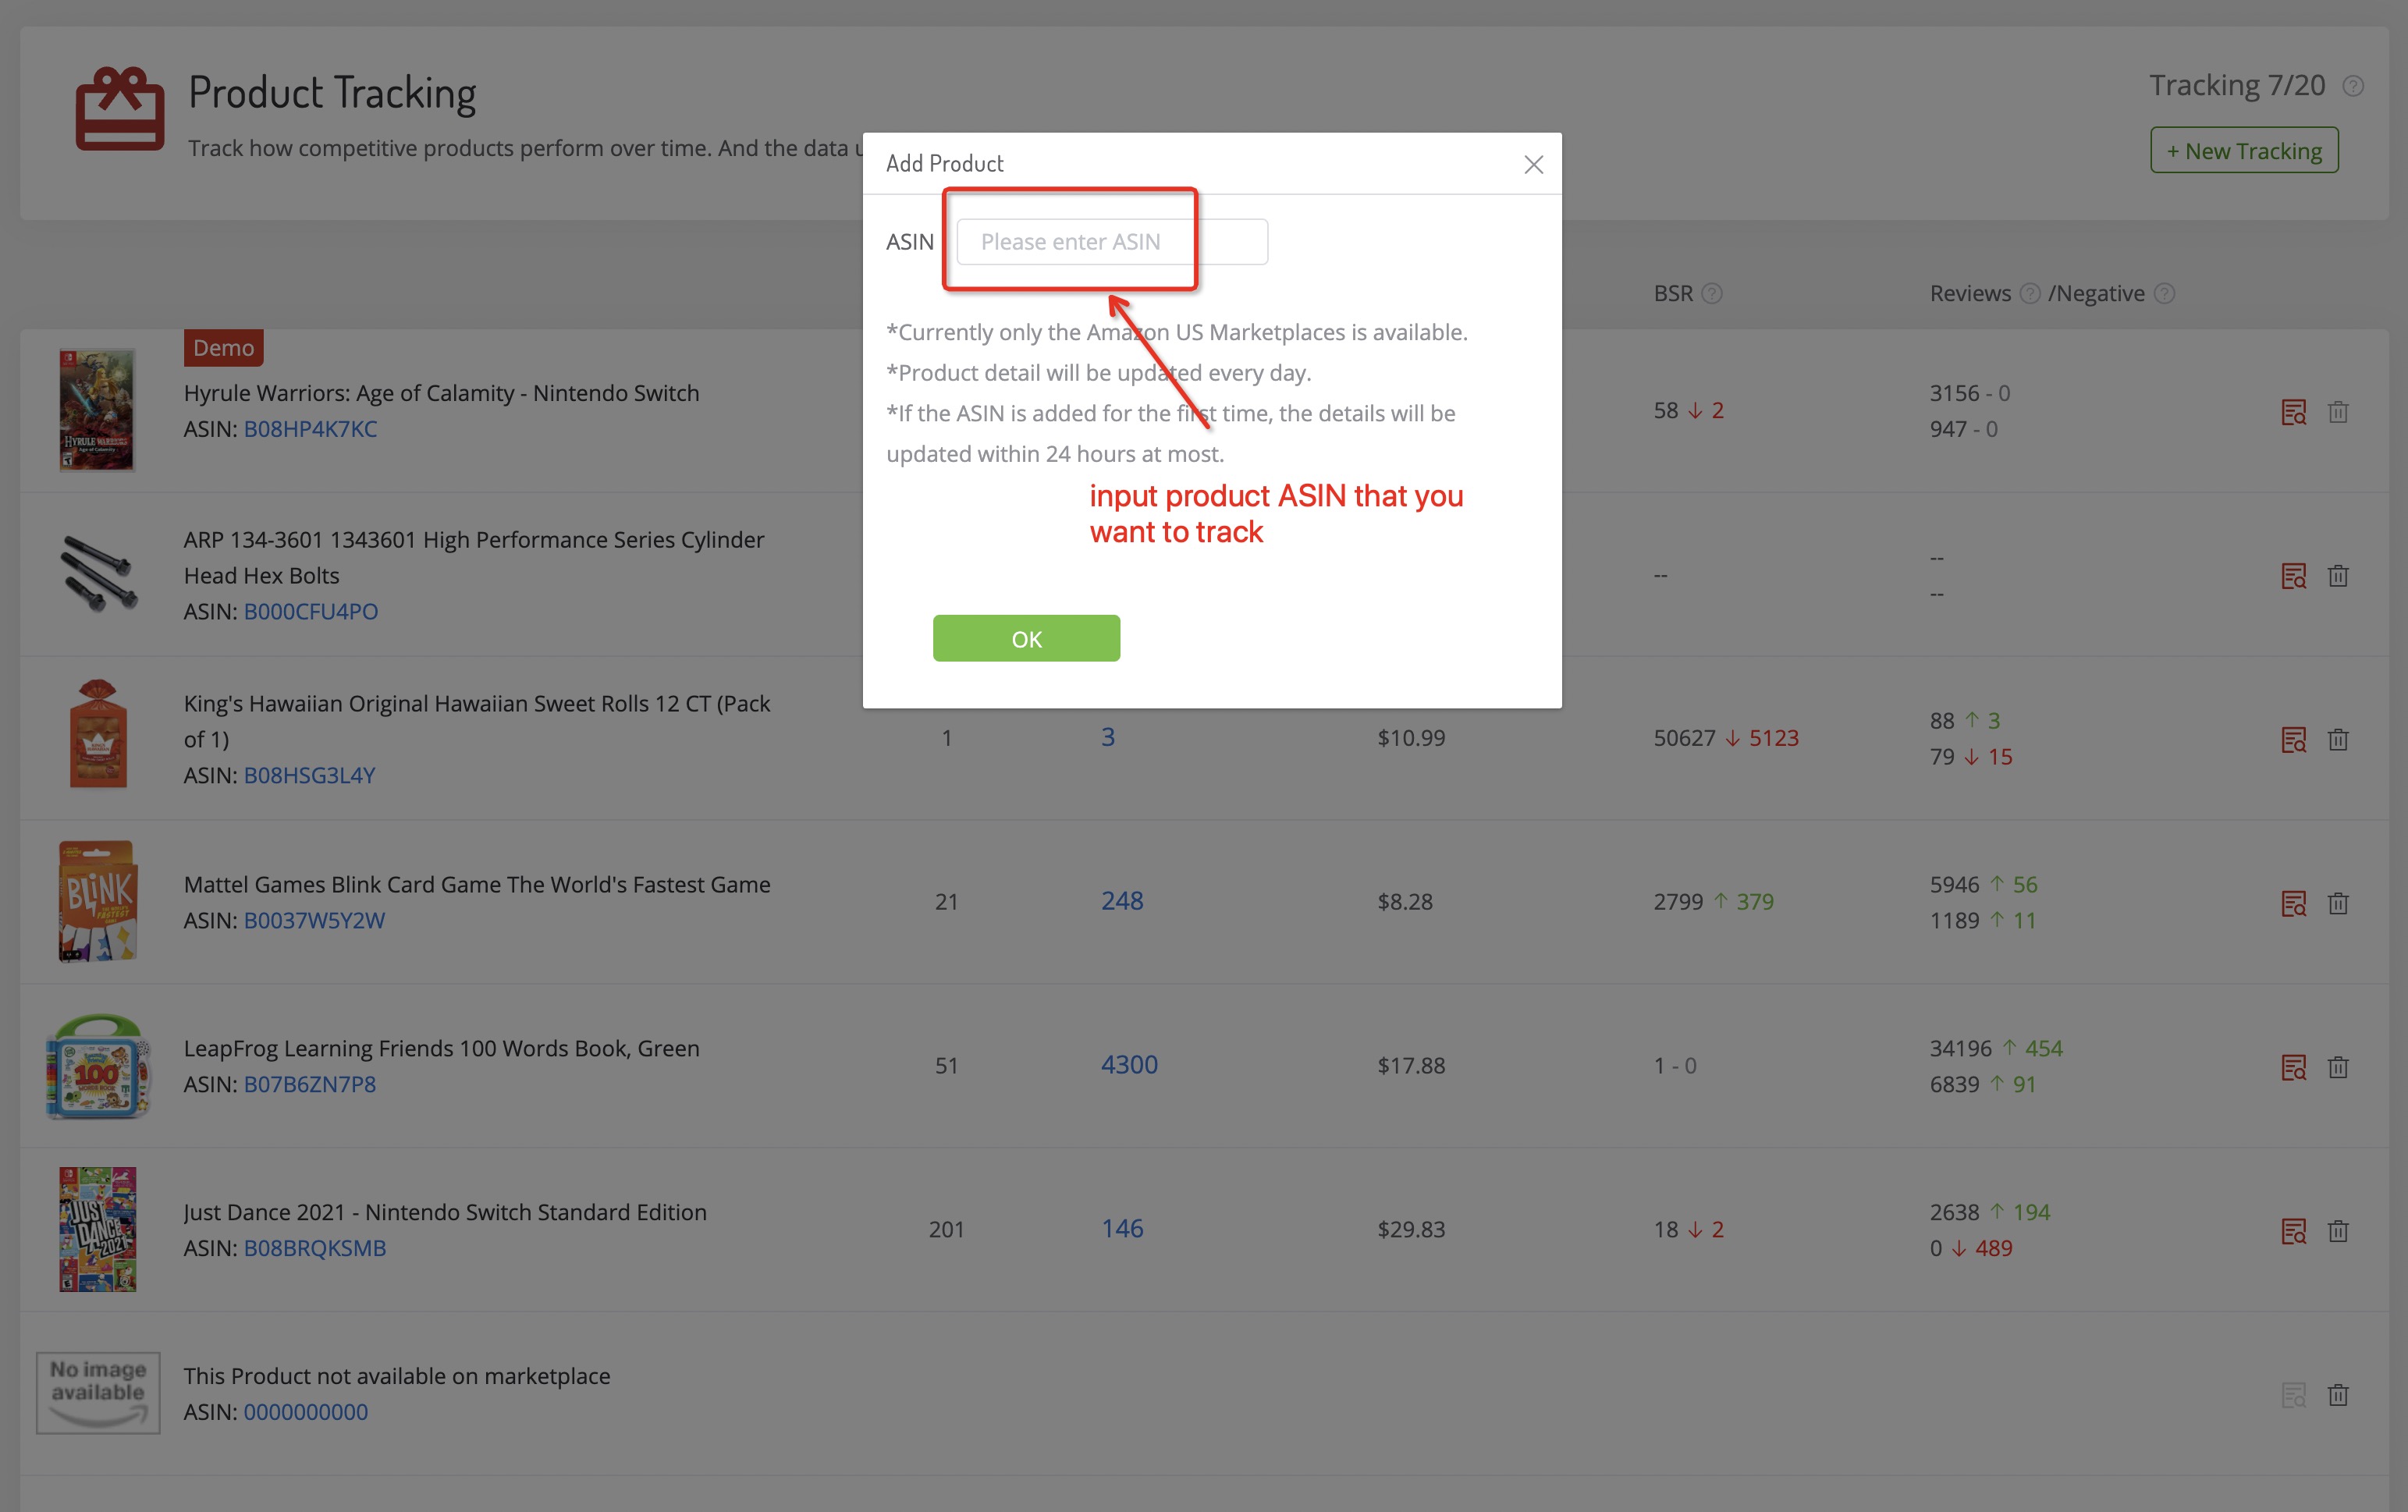
3.2.3.2 Input the product ASIN that you want to track in the pop-up window, click the “OK” button to put this ASIN into your tracking list.
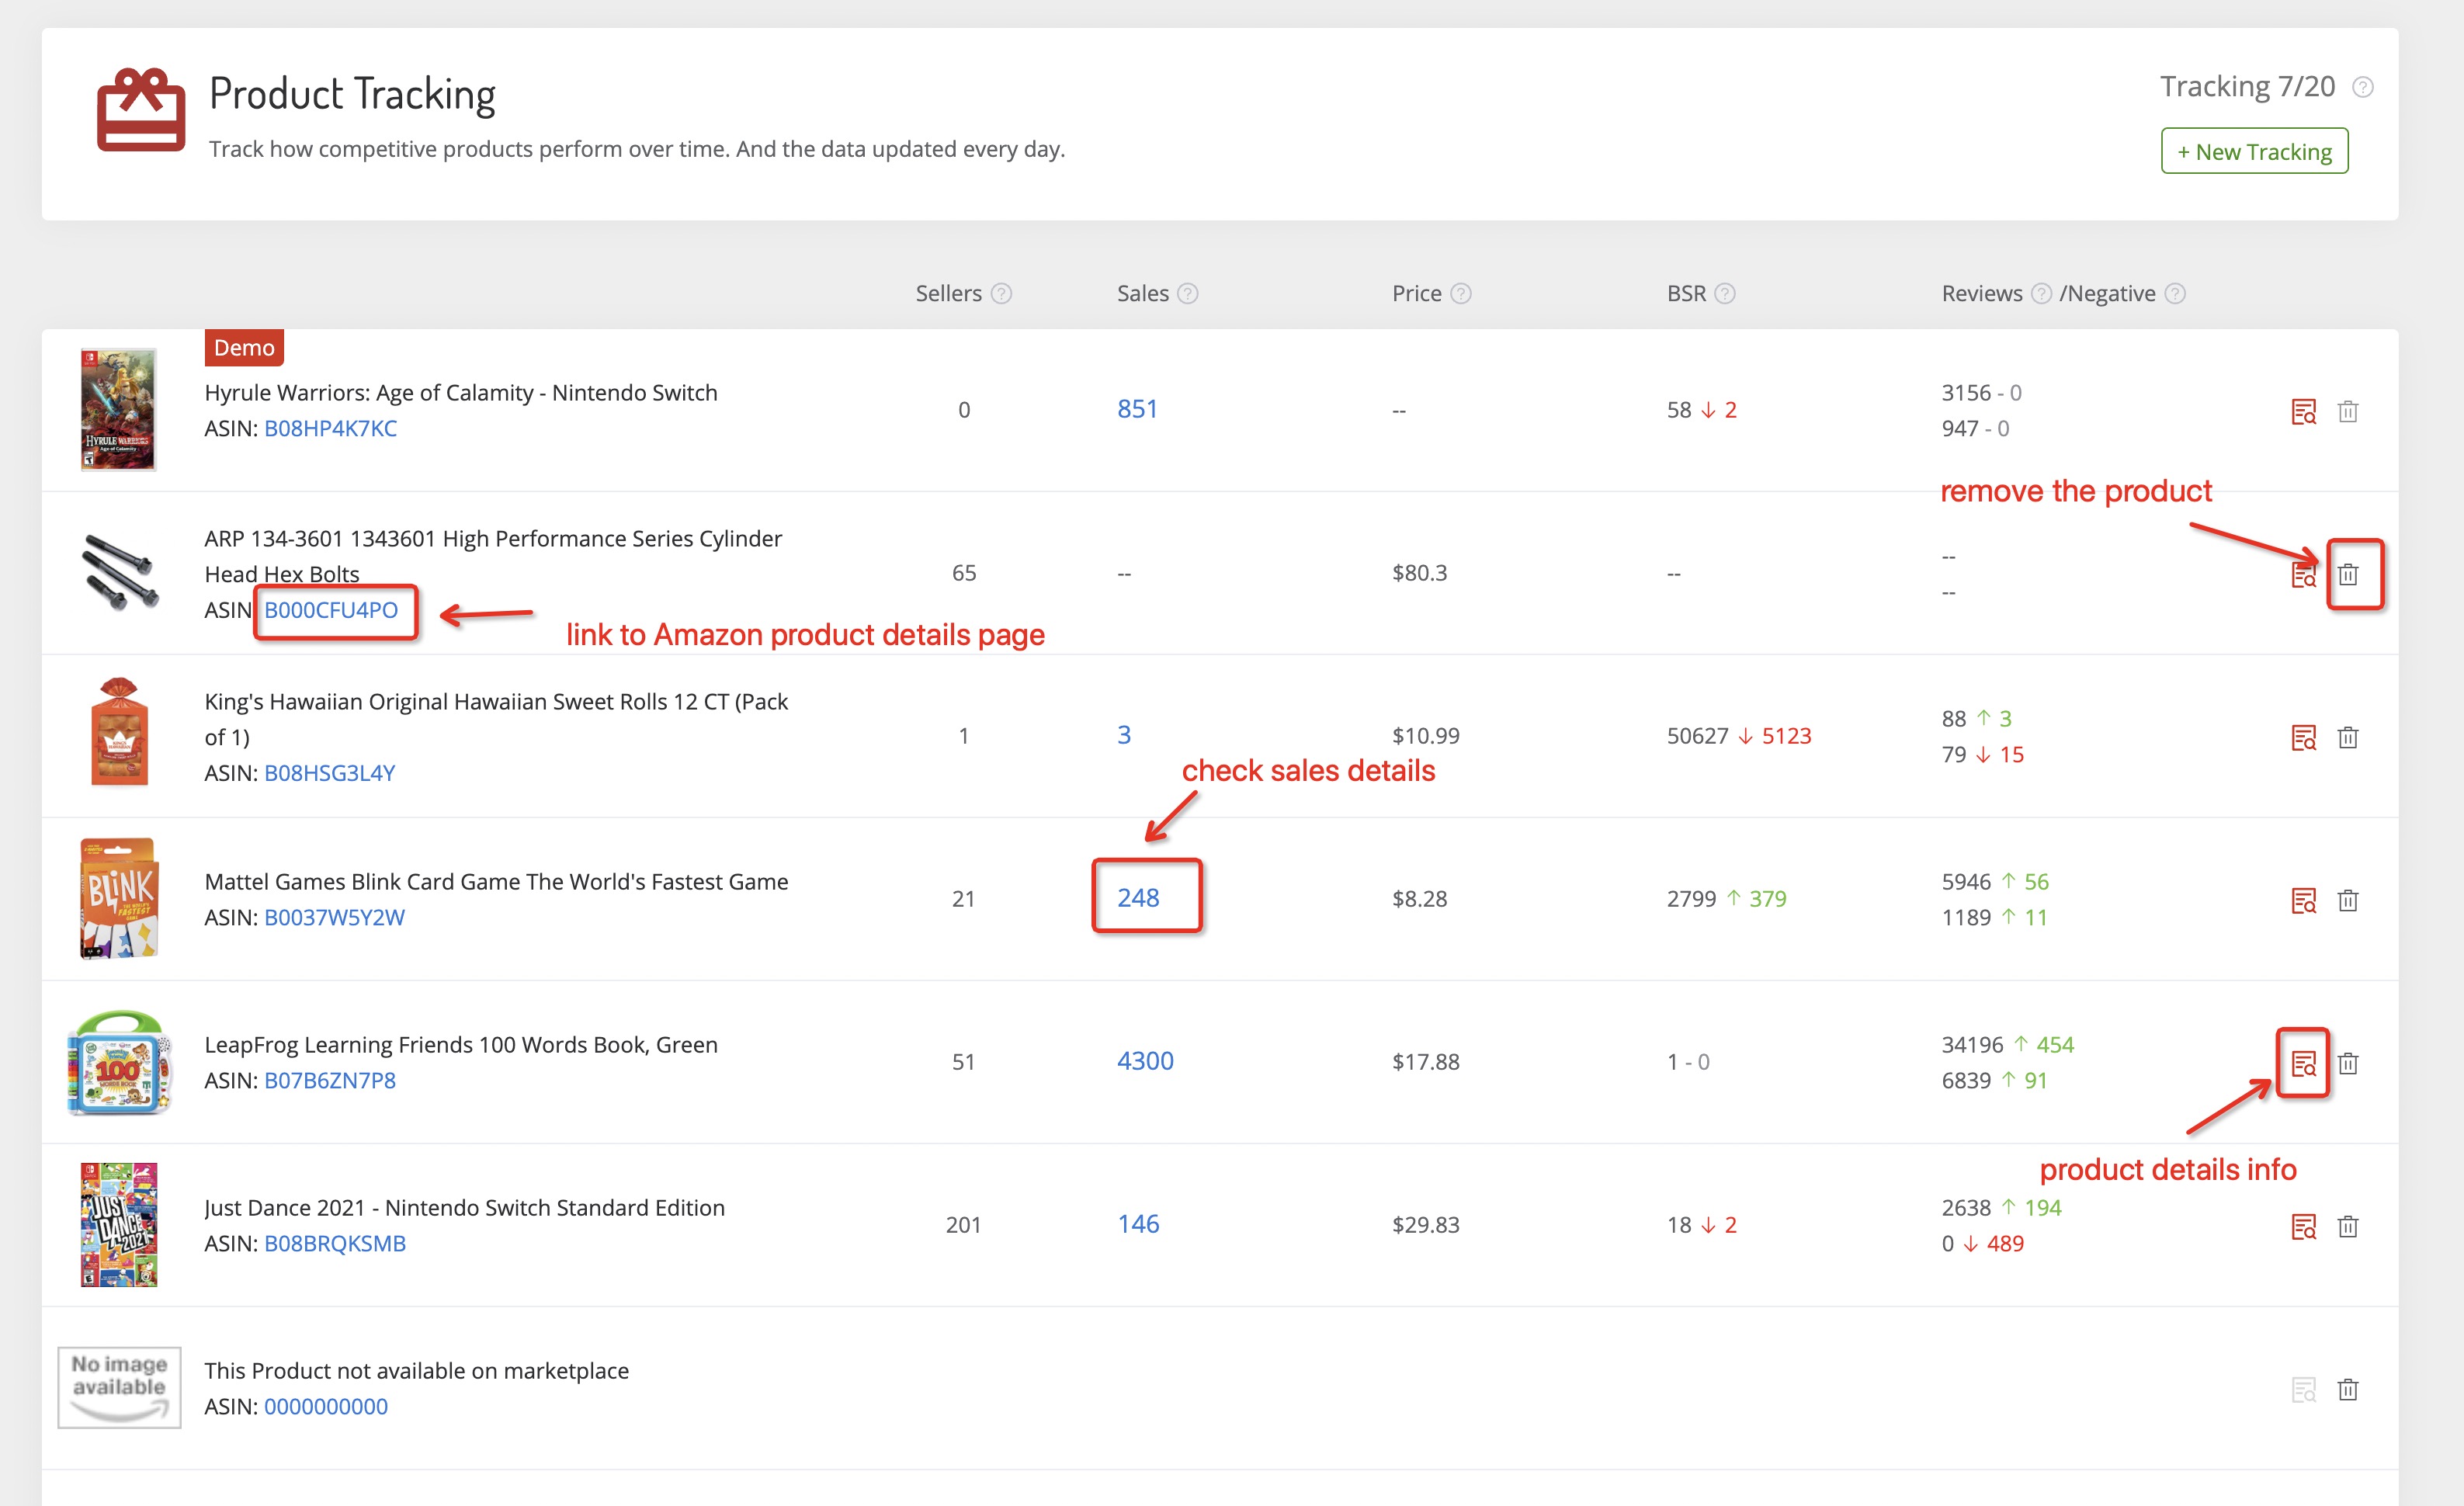
3.2.3.3 It shows a list of products that you are tracking, click the ASIN number and it will link to Amazon product’s details page, click the “Sales”, you can check the changes in sales of this product, and when clicking the “product details” icon, it will link to the product details page. Besides, you can remove the product from your tracking list by clicking the “delete” icon.
4. Keyword Scout
4.1 Reverse ASIN/Keyword Lookup
4.1.1 Usage Scenario
To get more traffic, Amazon sellers prefer long-tail keywords that on an upward trend and have a large search volume, purchase volume, and less competition. And Keyword Scout is well applied to find keywords popularity( search volume, purchase volume) and find some related long-tail keywords.
Keyword Scout also specializes in “amazon reverse ASIN lookup”, revealing competitors’ strategies by spying on the keywords any ASIN is using and currently ranking for.
4.1.2 Data Sources
The product data presented on the website are powered by our powerful database. After collecting and calculating, and the core keywords will be displayed..
4.1.3 Introduction to Functions
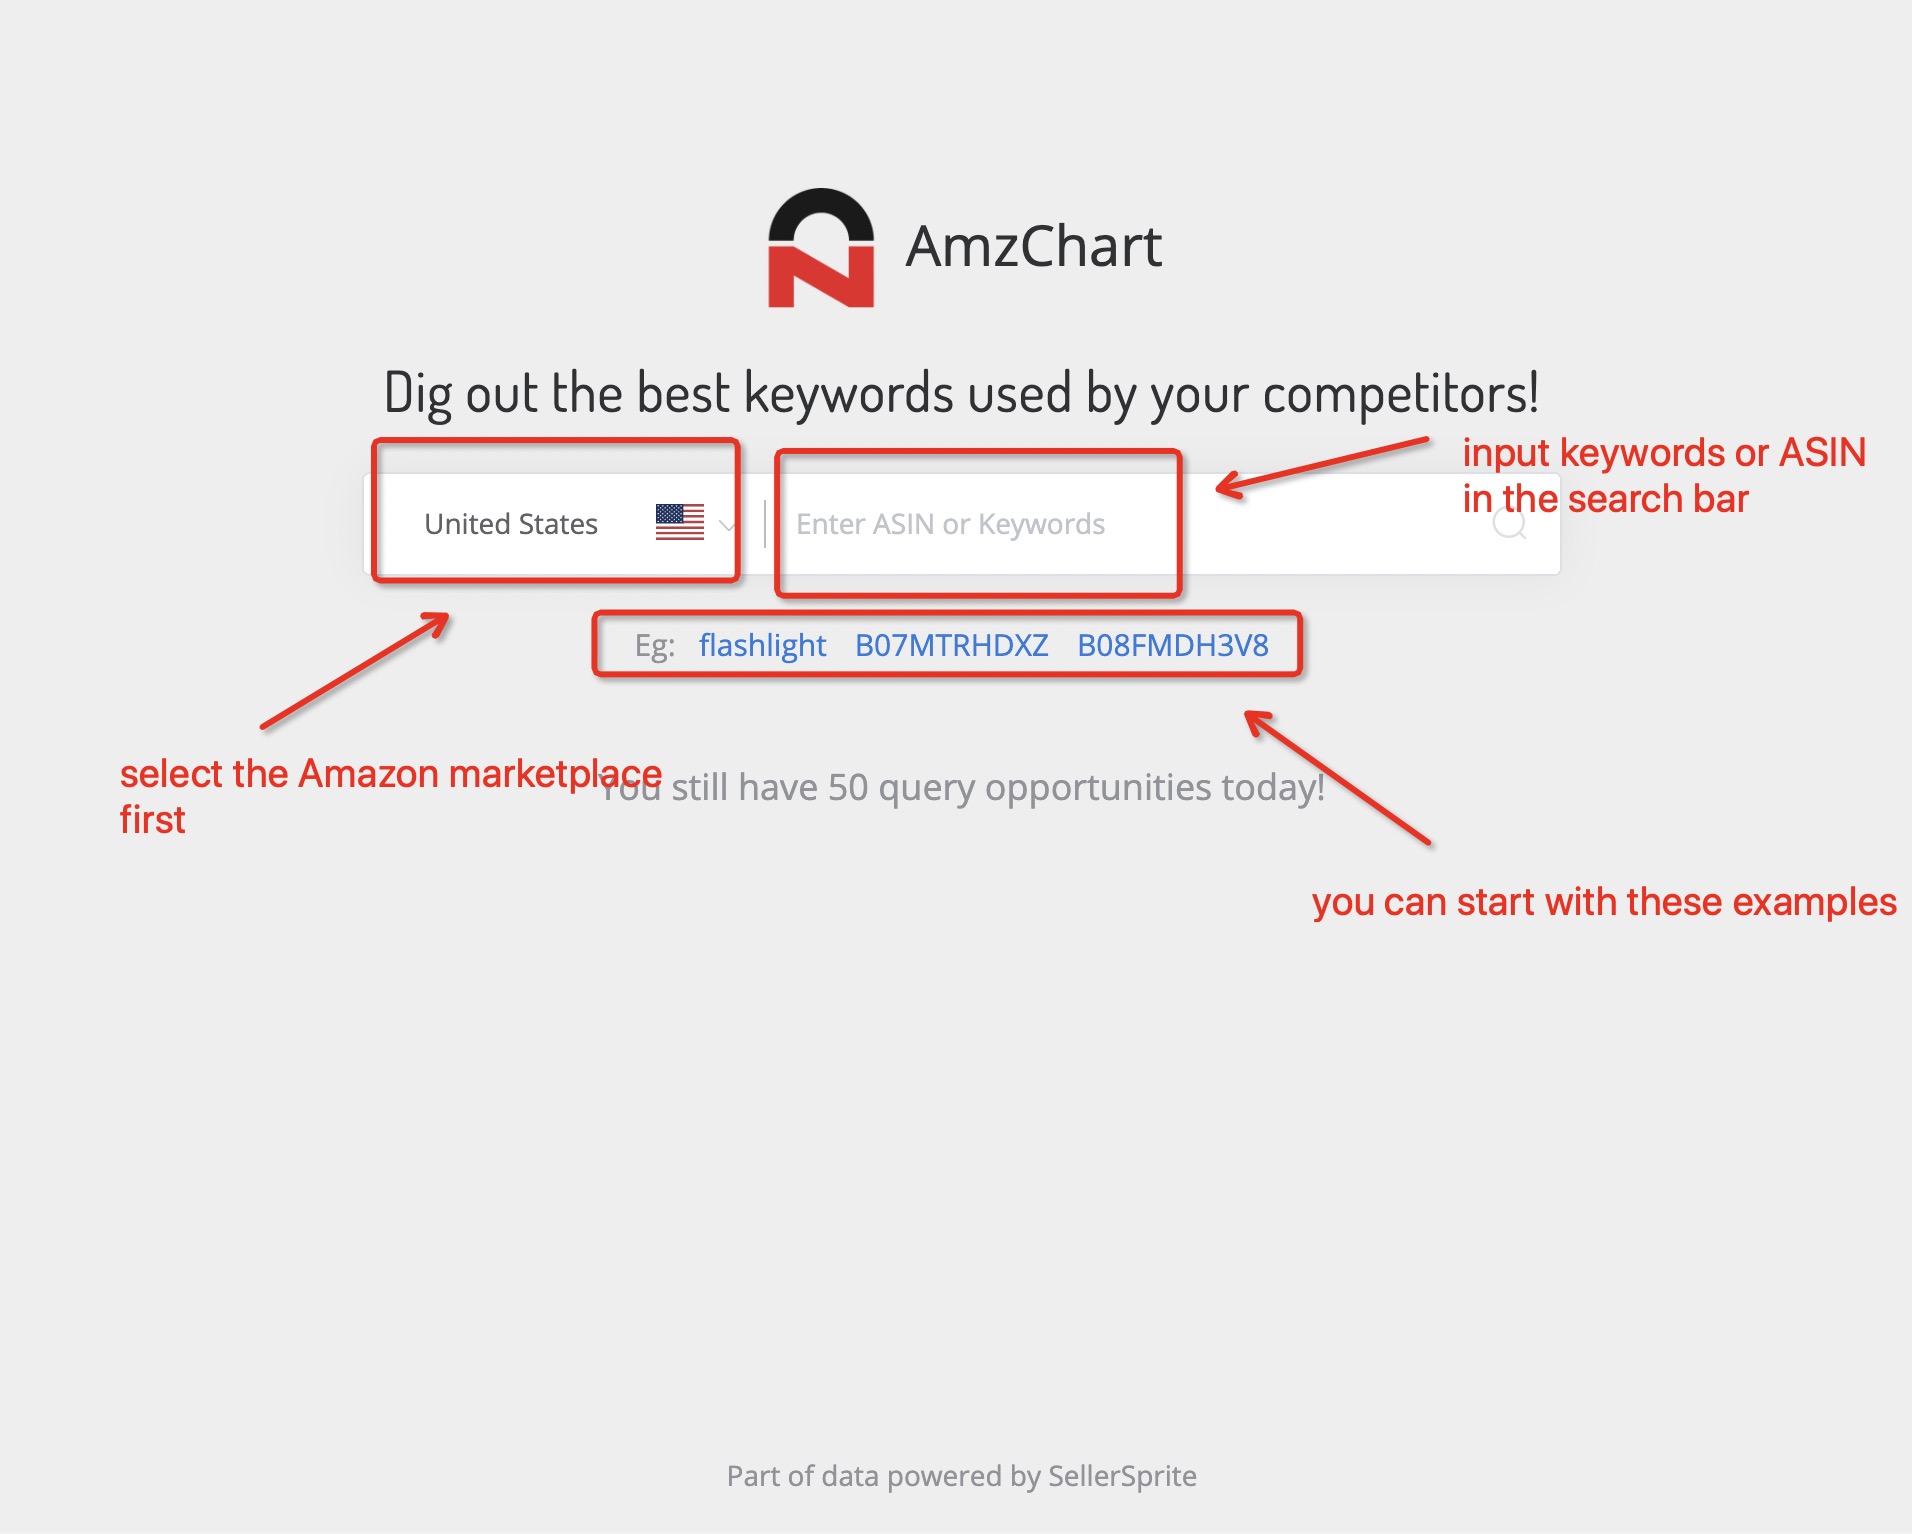
4.1.3.1 Select the Amazon marketplace first, then input keywords or ASIN in the search bar to start searching.
4.1.3.2 If you input a keyword in the search bar, you will get a list of related keywords & long-tail keywords as well as corresponding metrics about them such as monthly search volume, monthly purchase, number of products, and CVR(purchase rate).
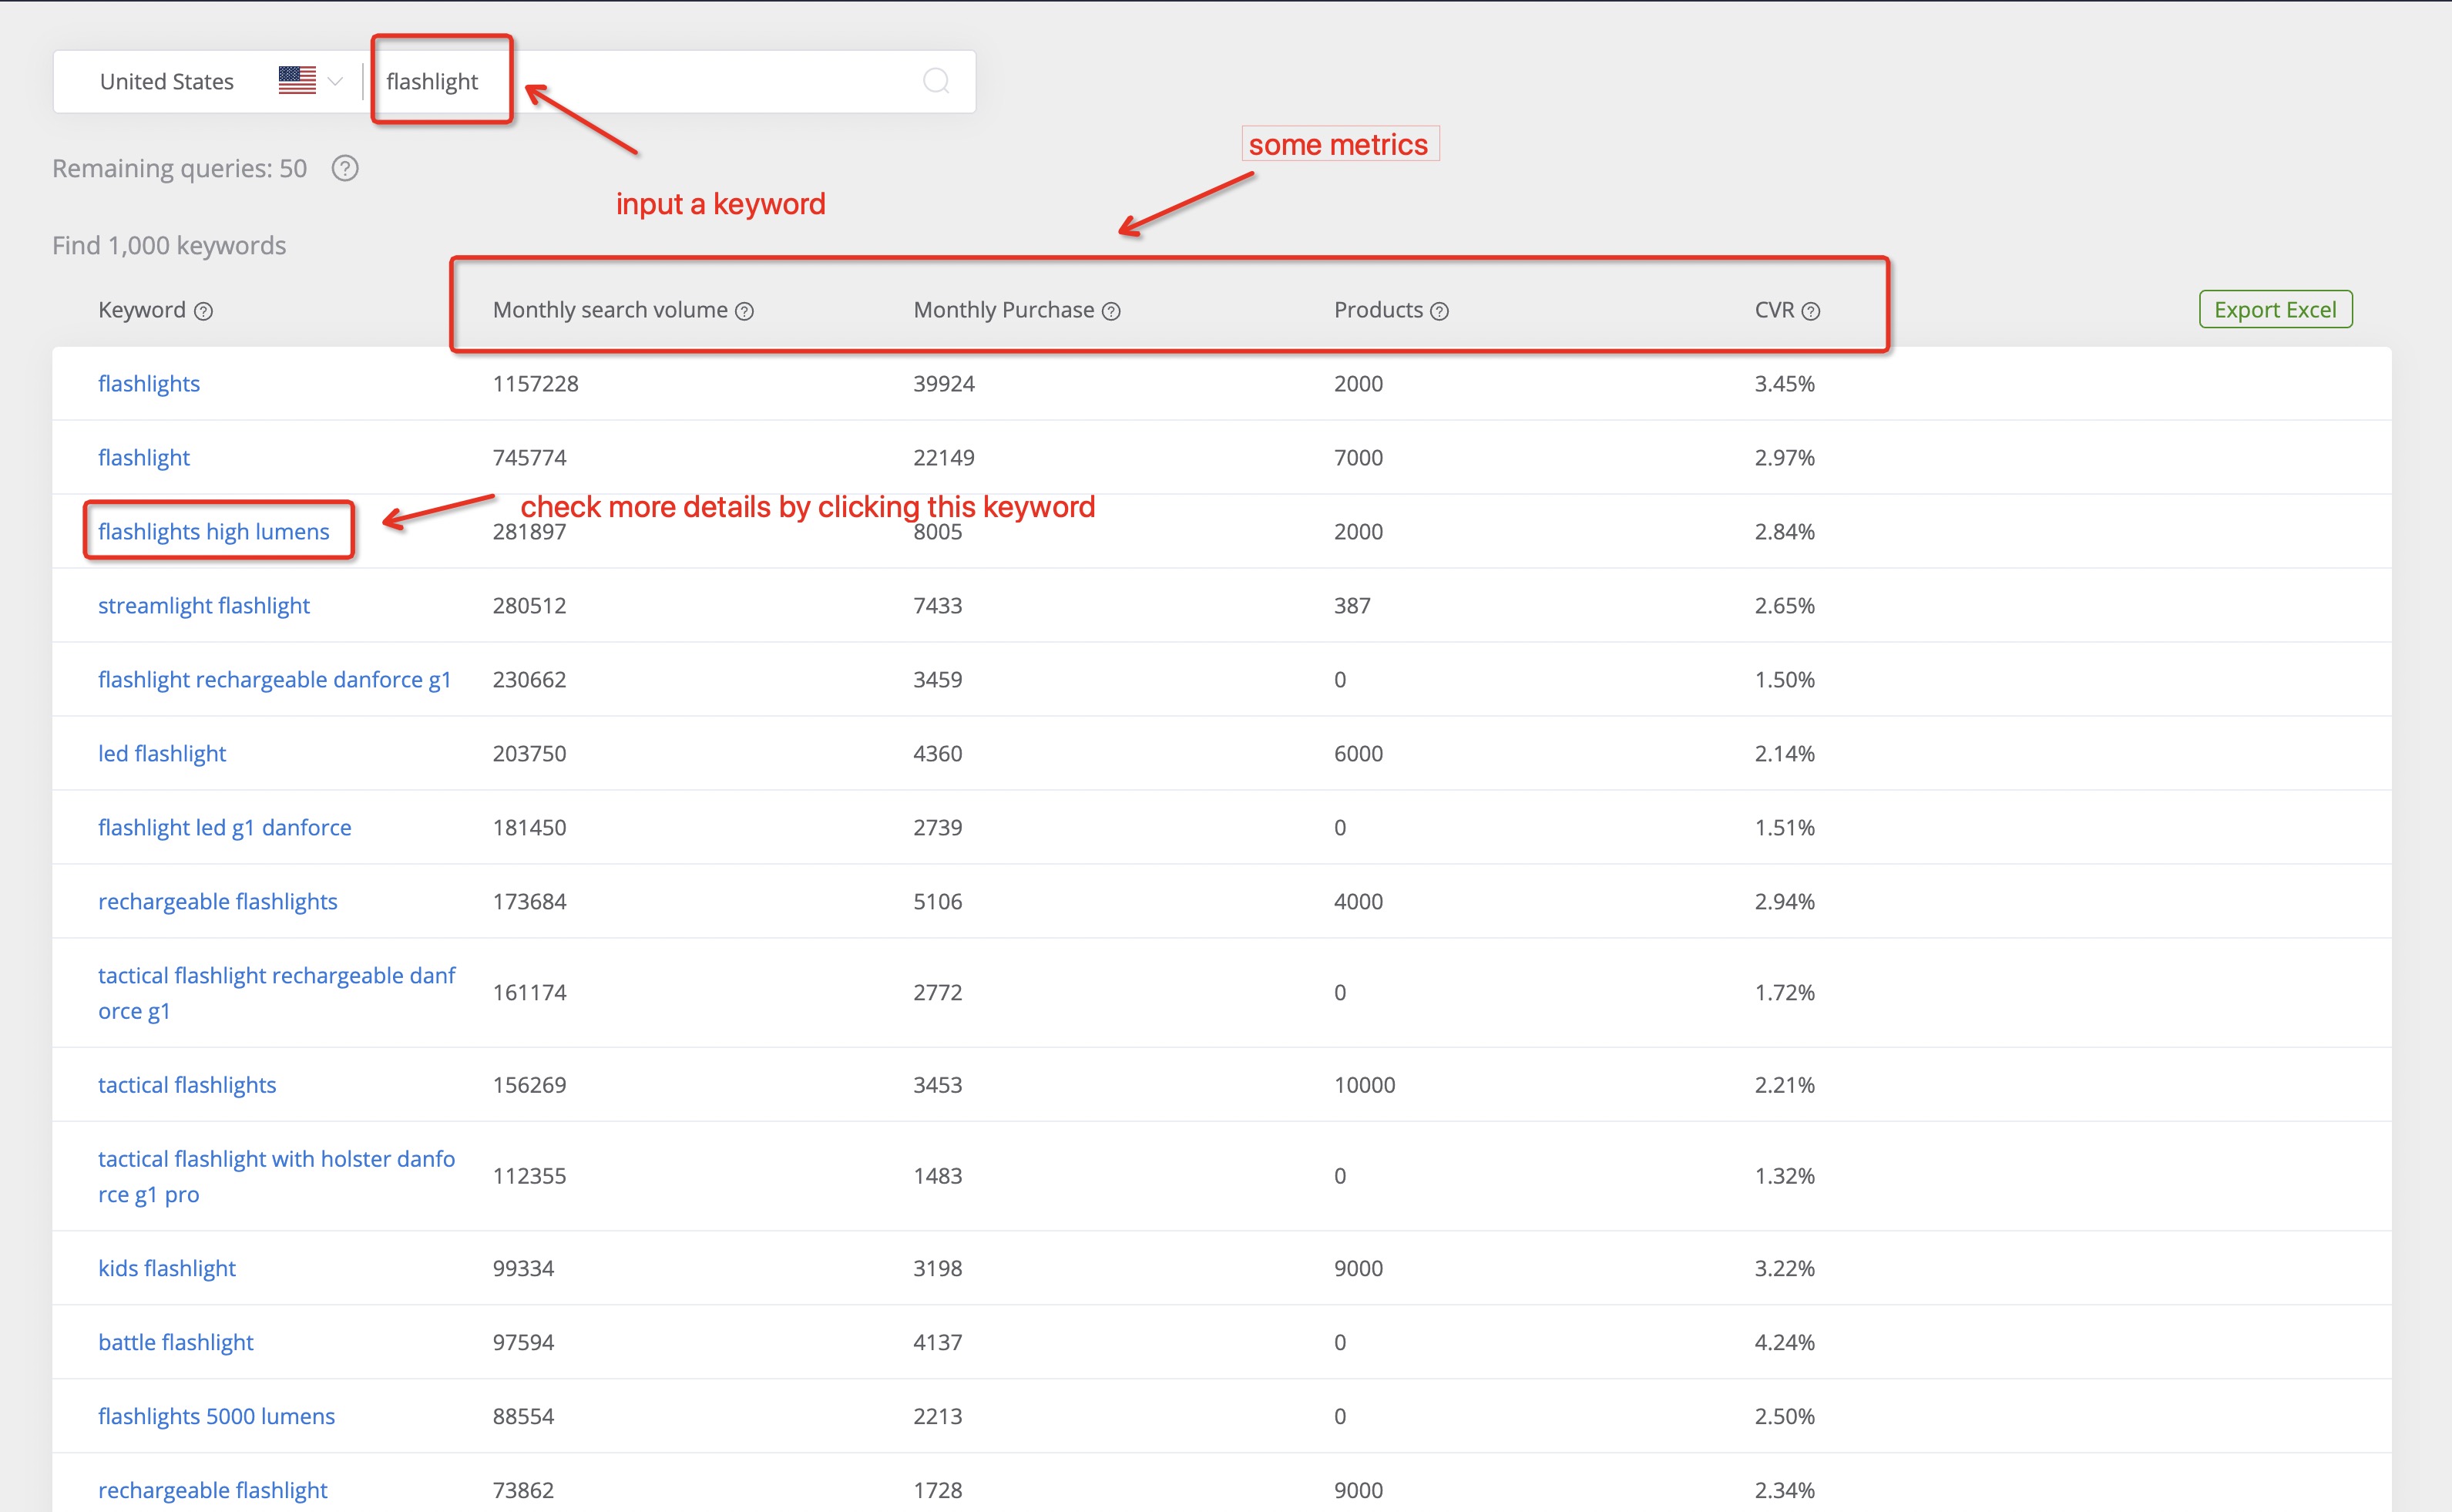
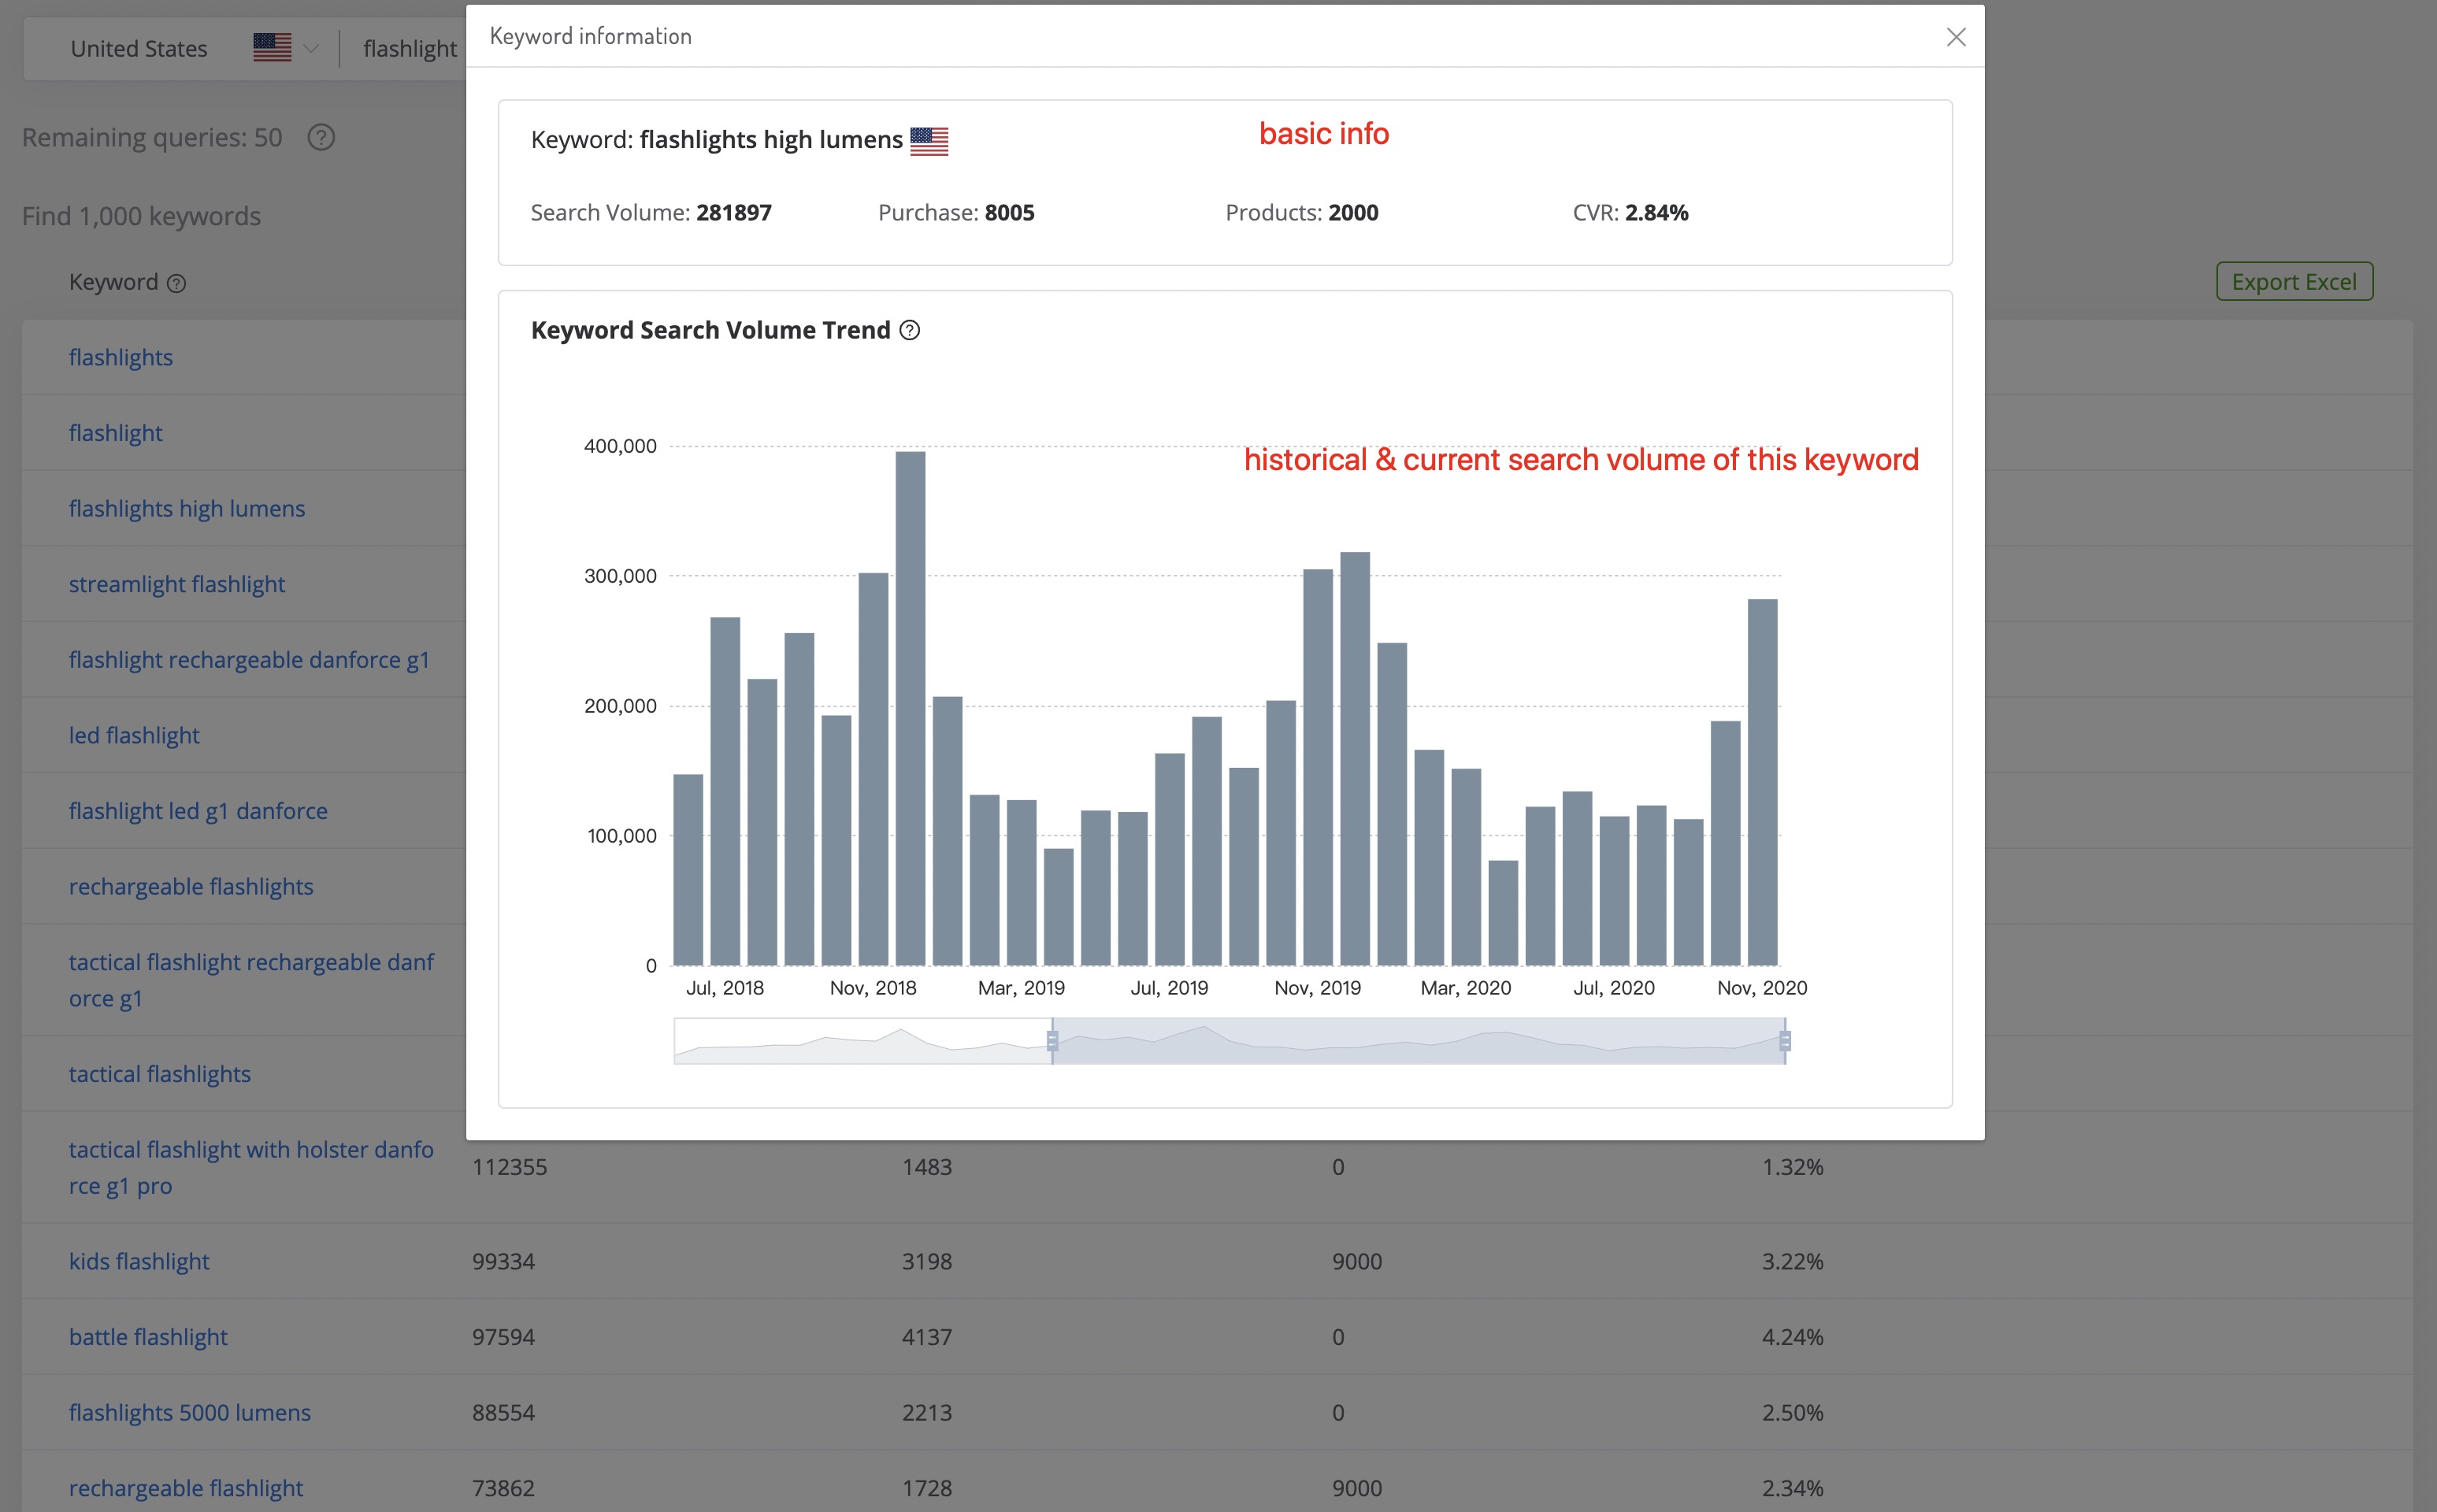
4.1.3.3 By clicking the keyword in the list of the related keywords, you can check the historical and current search volume of this keyword.
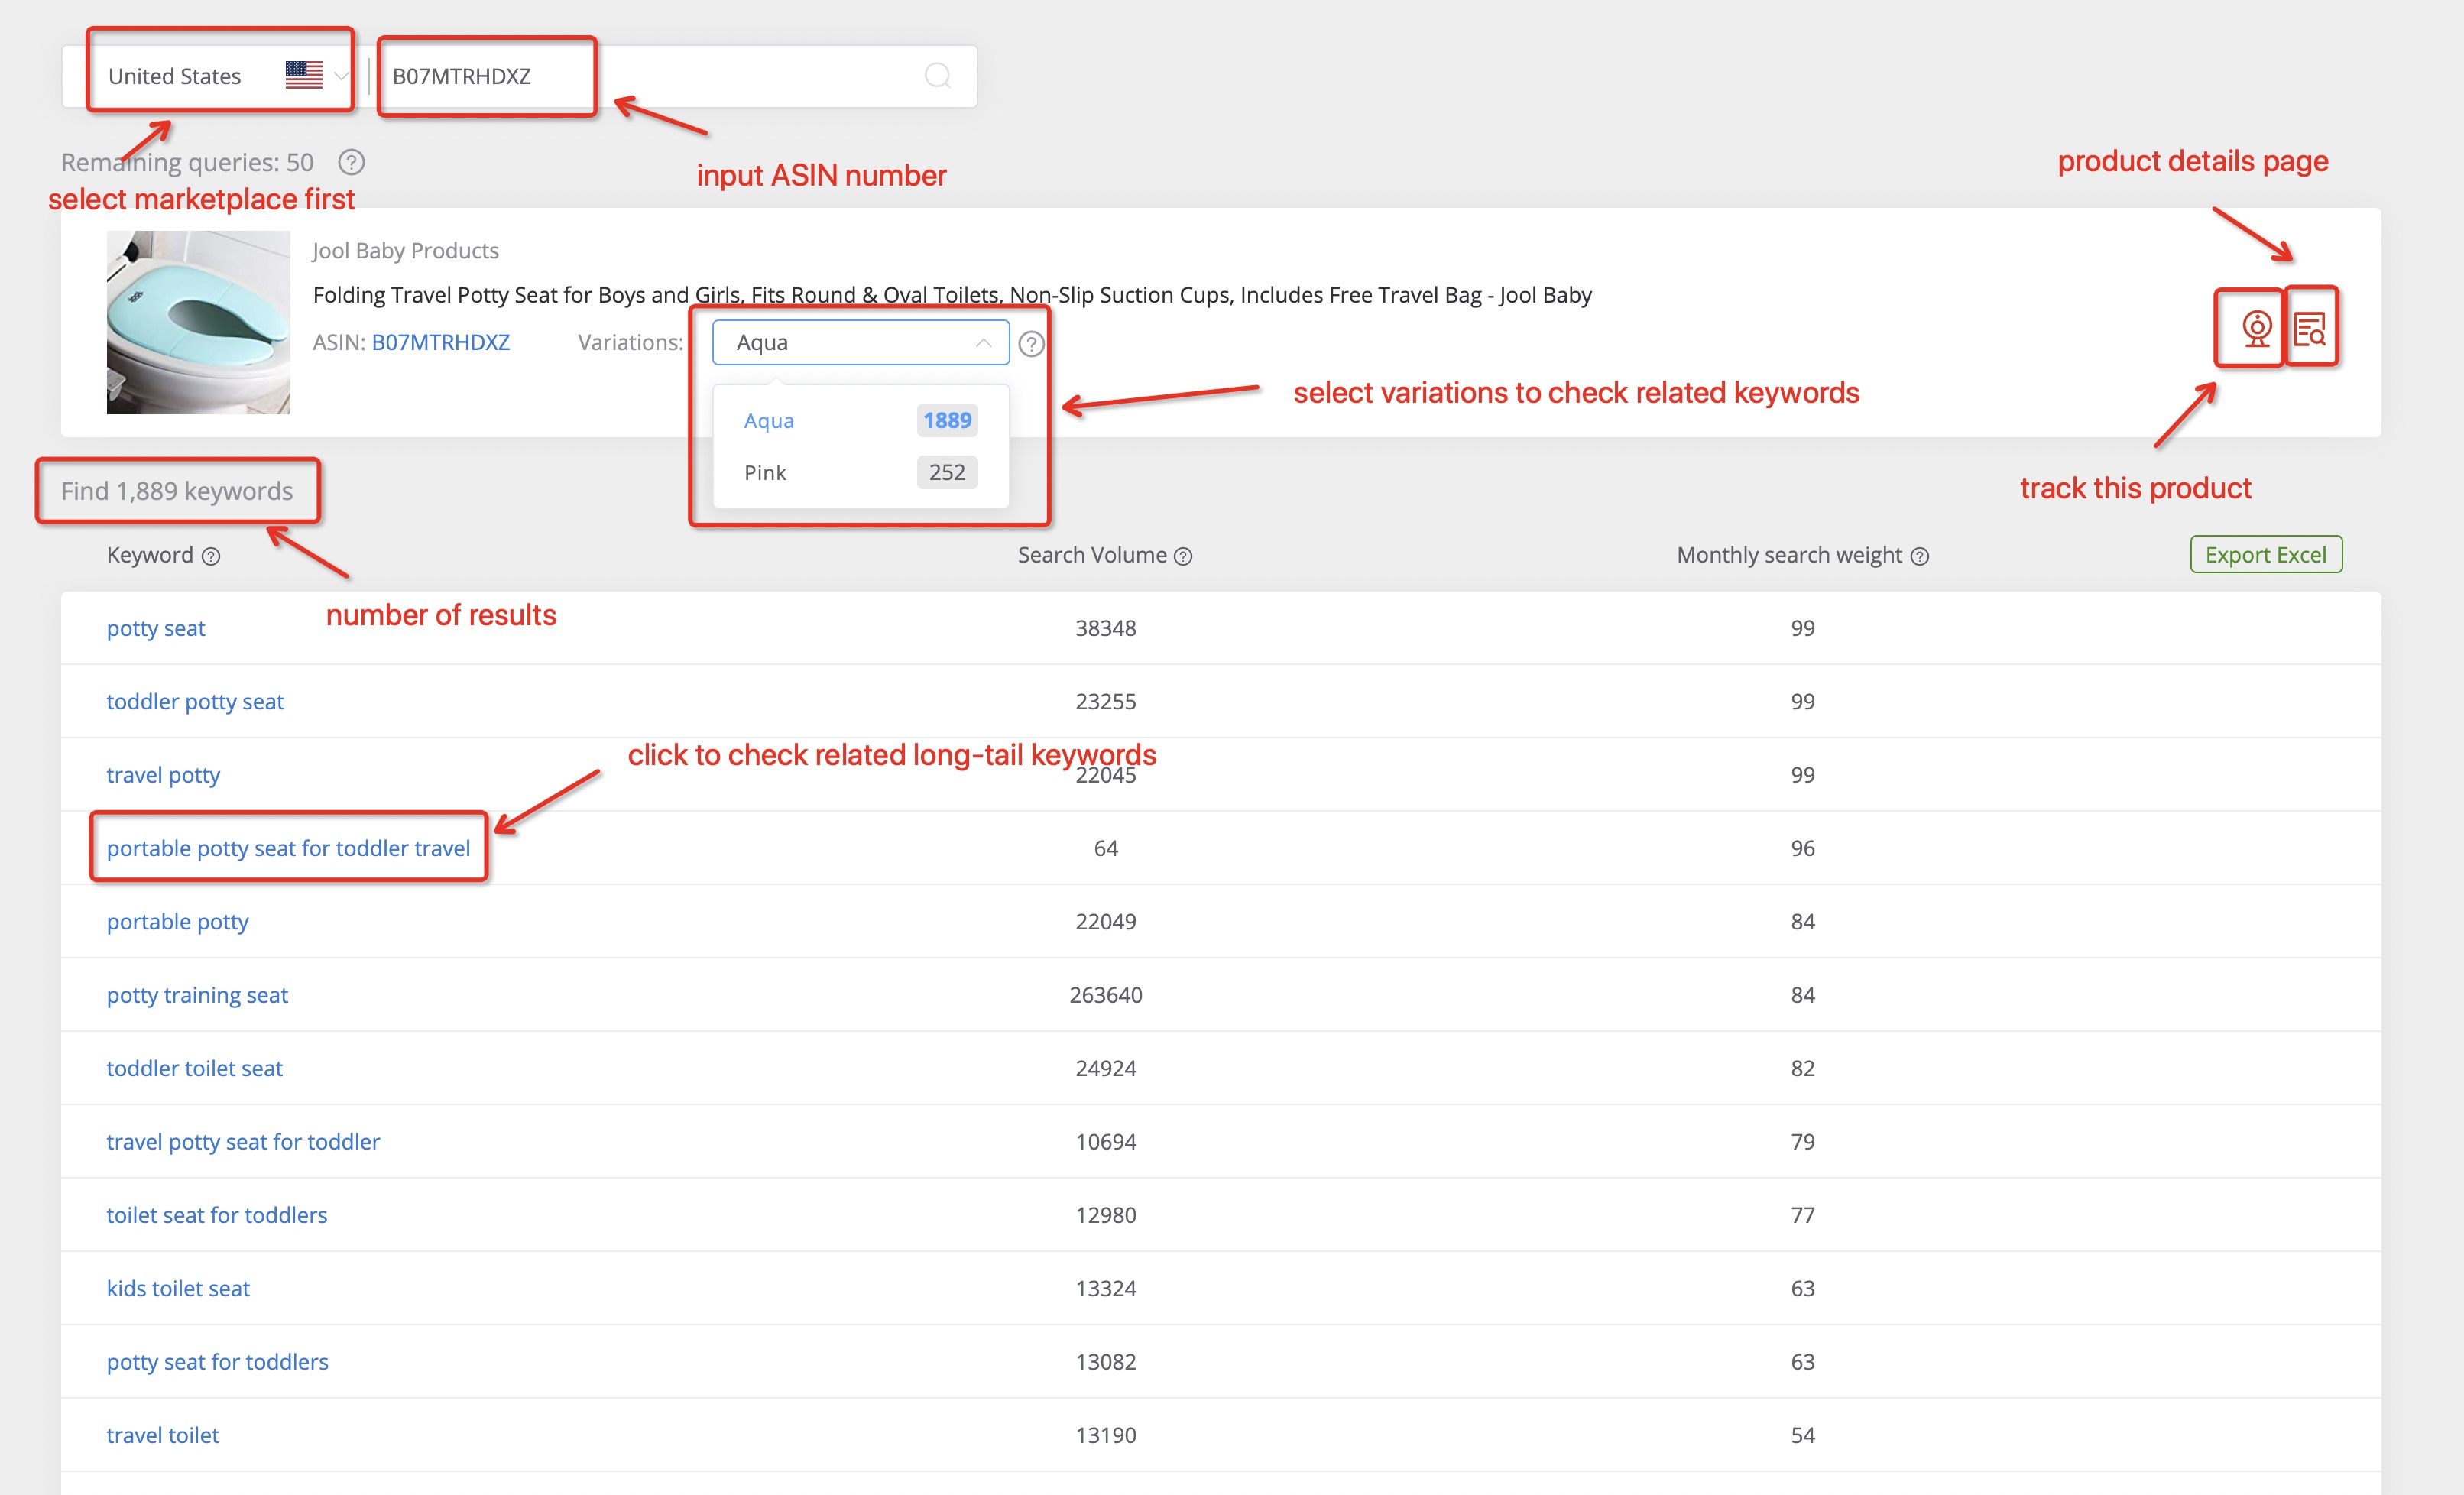
4.1.3.4 If you input a product ASIN in the search bar, you will get a list of keywords that this product currently ranking for, as well as the indicators like monthly search volume, monthly search weight of these keywords.
There are many things you can do on this page. Switch variation options to check the keywords that these variations currently ranking for. You can also add this product to your product tracking list by clicking the “Product Tracking” icon, when clicking “Product Details”, it will link to the product details page.
Furthermore, you can click each of these keywords listed below the product to get further information.